


1. Introduction
When estimating the causal relationship model, we often experience the case where the independent variable is continuous. In order to build the model, the researcher needs toassume and verify the change in the dependent variable according to the change in the continuous independent variable. What can be used here is a regression analysis. The linear regression, which is the most typical regression analysis, assumes that there is a linear relationship between an independent variable and a dependent variable.[1] The linear regression can be generalized to more complex regressions. For example, logistic regression analysis can be performed when the dependent variable is binary. Furthermore, if there is a covariate, multiple (=adjusted) regression analysis can be performed.
2. Correlation Coefficient
There can be situations which require checking whether there is a linear association or not between the two continuous variables.[2] The alternative hypothesis is that there is a linear association between the two continuous variables. The simplest way to confirm this is by calculating a correlation coefficient. The correlation coefficient quantitatively measures the linear association between the two variables. The result of the coefficient value is always between -1 and 1, regardless of the distribution of the two variables.
When calculating the correlation coefficient, two types of methods can be applied; a parametric method or a non-parametric method.[3] The parametric method can be used when at least one of the two continuous variables satisfies the normality conditions. The Pearson correlation analysis is a representative example of this.[4] The non-parametric method is used when both variables violate the normality. This corresponds with the Spearman correlation analysis, and the correlation coefficient is obtained by using the rank of each variable. Test methods for normality can be found in the previous paper.[5]
The interpretation of the correlation coefficient can be done as the following: there is no linear correlation in the case of 0; the closer to 1, the stronger the linear proportional relationship between each other is; if it is a negative digit and closer to -1, the inverse linear relationship is stronger. The greater the absolute value itself is, the stronger the linearity. However, in the case when the value is 0, it is premature to say the causal relationship among each other does not exist. This is because even if there is a nonlinear causality such as y=ax2, the correlation coefficient can be also 0. The analysis of the correlation coefficient provides a P-value, and similarly, if P<0.05, it can be said that the variables are linearly correlated.
Although the correlation coefficient has a disadvantage of not being able to detect nonlinear causal relationships, it is commonly used due to its simplicity. It provides a simple pair of standardized values (-1 to 1) and p-value, so it is effective when summarizing the correlation between many variables. The explanation of the linear regression below provides information on intensively in one or two variables.
3. Linear Regression
The most basic step in regression is to assume the relationship between the dependent variable Y and independent variable X.[6] After that, finding the constants constituting the relational expression is a key goal of regression analysis. The simplest linear regression of regression assumes the following relationship between Y and X.
After performing linear regression analysis, estimates of b0 and b1 are obtained. In addition, each P-value is provided for each coefficient, which means that the coefficient is not zero when P<0.05. Assuming that there is a linear relationship between height and weight, an example of regression analysis is shown (Fig. 1). This figure is embodied using SAS Software (version 9.4; SAS Institute)[7], with round dots representing the actual data values and the middle straight line representing the value of the regression equation. Blue shading represents the 95% confidence interval of the regression equation. Here, is the most interesting factor is that the confidence interval widens in the left and the right extremes.
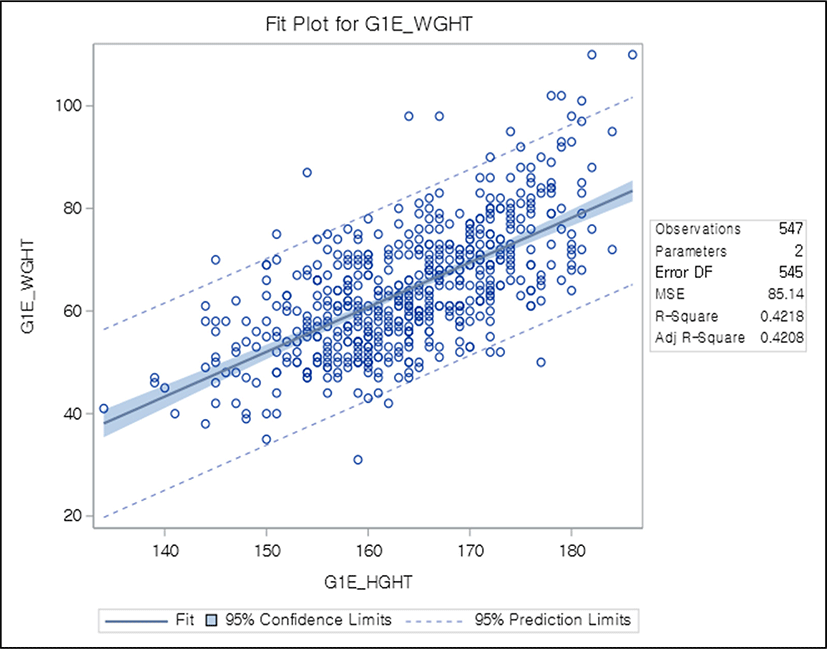
The R-square value in the figure is referred as the coefficient of determination, which refers to the proportion of the variance explained by the regression equation among the total variance in the data. Therefore, it has a value between 0 and 1. The closer to 1, the more significant the model.
When validating the regression analysis model, the nature of the error term (ei) is very important. The error terms of the values of each dependent variable should satisfy the following: 1) independent to the variable value (independence); 2) normally distributed (normality); and 3) equal variance (homoscedasticity). This corresponds to all regression analyses. In addition, in linear regression analysis, the relationship between the dependent variable and the independent variable must be linear (=linearity assumption).[6]
4. Multiple Regression (Adjusted Regression)
Several independent variables can affect the dependent variable. In the regression analysis, the simultaneous contribution of several independent variables (=multiple factors) can be measured as a single regression.[8] In this case, the contribution of each independent variable decreases, and thus the contribution and p value of the most important independent variable to be observed can also decrease by the simple regression (=single factor). From this perspective, regression analysis using several independent variables also can be called adjusted regression. Other independent variables that are not of main interest are called covariates.
Starting with the establishment of the relational expression, which is the basis of regression, linear regression analysis with n independent variables can be expressed as the following.
Such regression can be called a multiple regression in the sense that there are multiple independent variables. The independence, normality, and homoscedasticity of error terms should also be satisfied in multiple regression as for simple regression. Additionally, in multiple linear regressions, all independent variables (x1 to xn) must have a linear relationship with the dependent variable (=linearity assumption).
In multiple linear regression, a P-value for the entire model can be obtained, and P<0.05 means that neither of the coefficients from b1 to bn are not zero. In addition, each coefficient has a P value. For the k-th coefficient bk, P<0.05 means that the coefficient of the variable is not zero even after the adjustment of other variables (all variables x1 to xn except xk). In addition, the value of bk itself can be interpreted as a value that shows how much y increases per unit increase of xk when the remaining variables are fixed.
It would be ideal if each variable is independent from each other when several variables are included, but in reality, the action of a variable can vary depending on the change of the other variables. This is called an interaction, and it can be detected by adding a new variable called Xa*Xb to the model, which is a product of the two variables (Xa and Xb). When the P-value of the product variable is less than 0.05, there is an interaction between the two variables, suggesting the need for an advanced model or stratification analysis.[9]
The coefficient of determination can also be obtained through multiple linear regression. The R-square value generally increases when more independent variables are included in the model. Therefore, based on R-square, it may be misjudged as a good model when many variables are unconditionally included. This leads to the idea that a penalty is needed if the number of variables increases. The penalized result is called an adjusted R-square.[10]
5. Multicollinearity
When including several independent variables into the model, it should be noted that some of the independent variables are unnecessary.[11] For example, one independent variable may be configured in the form of a linear combination of the remaining independent variables. When performing multiple linear regression, the addition of this variable does not benefit the model. Multicollinearity is such a property in which one variable can be explained by a linear combination of the remaining variables. However, as a perfect multicollinearity does not exist, the degree of multicollinearity should be identified. Through the method using the conditional index, multicollinearity is usually suspected if the conditional index is higher than 10. Some researchers express this as an eigenvalue, which is the reciprocal of the conditional index. The multicollinearity is suspected when an eigenvalue is lower than 0.1.
When multicollinearity is suspected, it is most common to perform the regression analysis on each independent variable using the remaining independent variables to obtain a variance inflation factor (VIF).[12] If the VlF value of a specific variable is higher than 10, the model may be improved by deleting that variable. In addition to VIF, it is possible to examine whether each variable causes multicollinearity problems through methods including condition number and variance decomposition proportion (VDP).[11]
6. Variable Selection
If it is difficult to determine which independent variables should be removed with empirical knowledge, as the variables in the model can be reduced by data-driven methodology. The forward selection method is a method of adding significant independent variables one by one, and the independent variables once included are never removed from the model. The backward estimation method removes insignificant independent variables one by one, and the independent variables once removed are never included in the model. In addition to the above two methods, independent variables of the model can be reduced according to statistical procedures by methods such as a stepwise selection, maximum R2 improvement, minimum R2 improvement, R2 selection, adjusted R2 selection, and Mallows’ C selection.[13]
7. Categorical Independent Variable and Analysis of Variance (ANCOVA)
If the independent variable is categorical, it cannot be included in the linear regression model as it is.[14] However, in medicine, there are many categorical independent variables, which can act as a covariate. When these categorical covariates are included in the multiple linear regression model, dummy variables must be created. If the category of the corresponding covariate is n, then n-1 variables are created, and each variable is defined as 1 if the case belongs to that category and 0 if it is not. For example, if an assumption that there is a weight variable with three categories of obesity, underweight, and normal is made, for this categorical variable, two variables should be created, and the first variable is 1 for obese patients and 0 for non-obese patients. The second variable is 1 for underweight patients and 0 for non-weight patients. After this, two variables should be included in the model rather than the original weight variable.
If the categorical variable of the model is not covariate but the main independent variable, it is common to use ANCOVA, an extended model of ANOVA. Multiple linear regression and ANCOVA are completely identical in mathematical view. The only difference is the interpretation method. In particular, in the case of ANCOVA, a post-test can also be performed because it is ANOVA style analysis.[14]
8. Logistic Regression and Odds Ratio
On the other hand, even if the dependent variable is categorical, rather than an independent variable, dummy variables can be created and analyzed.[15] In this case, the dependent variables created have a value of 0 or 1. In order to regress the dependent variable with a value of 0 or 1, it is necessary to assume the relationship between the new dependent variable and the independent variable, which is the logit function. This is expressed in the following form:
Such a model is one of the generalized linear models. The generalized linear model is that linear regression with link function g() is applied to Y, such as g(Y) = Xb+e. For logistic regression, the logit function is used as a link function. Since the logit function is logit(u) = ln[u/(1-u)], the above equation corresponds to Y ~ exp(b0 + b1X) / 1 + exp(b0 + b1X). It has a form that Y increases in an S shape as X increases.
Logistic regression analysis can also use several independent variables, where it becomes logit(Y) ~ b0 + b1X1 + … + bnXn. Similarly, P<0.05 in the entire model means that all coefficients b1, …, bn are not zero. Likewise, P<0.05 of the k-th coefficient means that when another variable is fixed, the Y effect of the variable Xk is not zero.
The coefficient analysis of logistic regression analysis requires the concept of the odds ratio. For the purposes of this research, the ratio of the probability of success to the probability of failure (P vs. 1-P) shall be defined as odds. What the regression equation of logistic regression draws is the probability that Y is 1 for that X. Accordingly, the odds may be expressed by Y/(1-Y) = exp (b0+b1X). And when X increases by 1, the new odds become exp (b0+b1(X+1)), and the odds ratio is exp (b1). Therefore, exp (b1) can be interpreted as an odds ratio, which represents the rate of increase in odds when X increases by 1.[15, 16]
9. Modified Poisson Regression and Relative Risk
The odds ratio is not a relative risk. The relative risk and odds ratio are similar in value when they are near the value 1.[17] Also, when the odds ratio increases, the relative risk also increases, so the odds ratio can be presented instead of the relative risk in many kinds of research. However, due to the difficulty of interpreting the odds ratio, researchers may want to seek relative risk. In this case, instead of logistic regression, researchers can perform the modified Poisson regression and present the exp (b1) value obtained through it. It is equal to the relative risk.[7]
10. Conclusion
Regression analysis is the most famous methodology for medical studies with continuous independent variables. Researchers can face criticism from peer reviewers if the regression analysis model is well not justified. Therefore, understanding in statistical background of regression analyses explained in this article is required. Based on this article, researchers can choose a proper method and produce statistically robust models.
This statistical standard and guideline of Life Cycle Committee discusses regression analysis (i.e., a simple correlation coefficient, linear regression, multi-factor regression analysis, analysis of covariance, logistic regression, and modified Poisson regression) to promote the understanding of medical researchers.