


1. Introduction
Propensity score matching is a useful research design that reduces the impact of many independent variables that have received relatively low interest from researchers (i.e., covariates or confounding variables).[1] In a regression model, a regression equation is constructed by putting all covariates as independent variables and then performing the regression. For example, when establishing a logistic regression model that predicts a disease, the analysis is performed by putting all covariates as the following[2].
If there are too many variables included as covariates, the model is likely to lose its statistical power. This happens because as the covariate increases, a curse of dimension problems occurs due to problems of collinearity and interpretability. Propensity score matching can appropriately remove covariates from the model when there are many covariates.[3]
The first step to understand this mechanism is knowing the definition of covariates.[4] Covariates are variables that are correlated with the main independent variable which must have effect on the outcome to be included in the model.[5] Therefore, in order to remove certain covariates from the model, it must be arguable that (1) they do not correlate with the main independent variable, or (2) covariates have no effect on the outcome.
In the case of (2), the argument that any of the covariates have no effect on the outcome becomes the subjective opinion of the researcher. On the other hand, there is a possibility that other researchers or the paper reviewer can disagree and think that the covariate has an effect on the outcome.[6] Therefore, method (2) can be seen as a difficult or controversial process. In the case of (1), it is possible to eliminate the correlation between the main independent variable and the covariate, which is the core principle of propensity score matching.
For example, in the randomized controlled trial (RCT), the main independent variable is assigned completely randomly for each object.[7] Therefore, theoretically, no covariates can correlate with the main observation factor unless by coincidence. If 100 patients were assigned to a treatment group and a control group with a 50:50 chance coin toss, we expect the mean and distribution of the treatment group and the control group’s age, gender, and all other variables to be the same.
In observational studies, since the main independent variable is not randomly assigned, the possibility of it being irrelevant to covariates is low.[8] If the main independent variable is treated or not treated with a specific medication, the covariates such as age, gender, and history may have some kind of correlation with the medicine use. Although observational research has such disadvantages of covariates compared to RCT, it is impossible to enforce RCT for collecting data in the real world. Therefore, propensity score matching, a realistic and observational research methodology that breaks (1) to mimic RCT, is used widely.[9]
2. What is the propensity score
For the purpose of this study, X shall be assumed as the main independent variable. X=1 shall be the treatment group, and X=0 the control group. A model can be established to obtain the probability that X equals 1 by covariates. For example, the logistic model is as the following[10]:
For each patient, the probability that X is 1 in the above model can be calculated by the given covariate value. The above probability is called the propensity score. In addition to the logistic model, any methods or models can be used to estimate this propensity score value, including machine learning or artificial intelligence models, but the most commonly used model is the logistic model. As the propensity score value is a probability, each patient has a value between 0 and 1.
In propensity score matching, the word propensity was named because the propensity is assigned to the treatment group (i.e. X=1).[11] When researchers observe patients in group X=1, the overall propensity score will be close to 1, and when they observe patients in group X=0, the propensity score will be close to 0. When matching and extracting patients with similar propensity scores among patients in the X=1 group and patients in the X=0 group, the propensity score distribution in the extracted patients becomes the same. In this way, the selected patients have a similar mean and distribution of covariates in the treatment and control groups, regardless of whether X is 0 or 1. Such method is the concept of propensity score matching.[12]
3. Case-control matching
Up to this point, it is possible to argue that without this complicated process, if all covariates are separately matched and pulled out of matched patients, the covariates shall become the same after the extraction is completed. Doing so instead of matching the propensity score in the group with X=0 and X=1 is called case-control matching.[13] For example, if the covariates are age, gender, smoking history, and diabetes history, then the patients selected from the X=1 group and people with the same age, gender, smoking history, and diabetes history are selected from the X=0 group. Repeating this creates a group of final study subjects.
However, the problem with this method is that, if there are dozens of confounding variables, the matching is nearly impossible.[14] The possibility of finding all patients in the control group whose dozens of confounding variables are all matched equally is almost zero. Even if some error range is allowed to increase the matched patients, the algorithm takes too long. On the other hand, propensity score matching has superior matching performance because it matches based on only one value, the propensity score. The principle of dimensionality reduction is applied.
4. Standardized mean difference
Propensity score matching, which matches all covariates after reducing their dimensions to propensity score instead of matching themselves, does not guarantee that all covariates are perfectly matched. Therefore, it is necessary to look at the difference between the covariates of the two groups after matching, and it is standard to use the value of standardized mean difference (SMD).[15] SMD, which stands for standardized mean difference, can be calculated for each covariate. If the SMD value of the covariate is less than 0.1, it can be seen that the difference between the two groups is small after matching.[16] Of course, this value of 0.1 is not a fixed absolute standard because there is no mathematically accurate basis. As many studies set the alpha value at 0.05, previous researchers set it to 0.1 as a rule of thumb. It can be said that the smaller the SMD, the smaller the difference in the corresponding covariates.
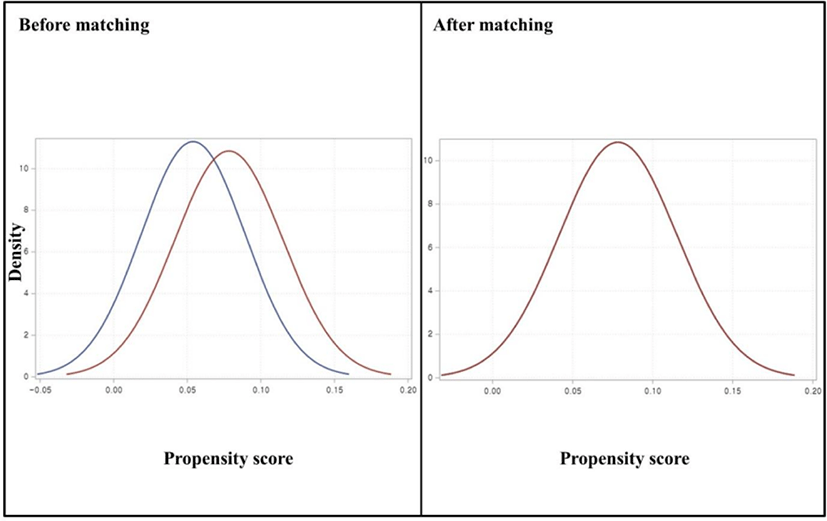
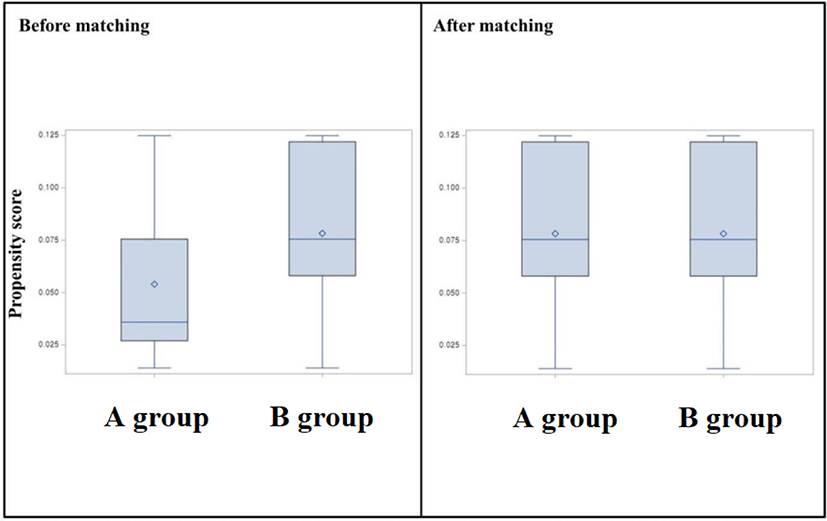
As a method of testing the difference between the specific covariates of the two groups, the P-value of the test can also be investigated through a t-test or the like. However, these methods are rarely used. This is because the P-value tends to decrease in studies with a large number of sample size.[17] Therefore, if the P-value is used and the test standard is set at 0.05, it detects the difference between the two groups more than necessary. On the other hand, since SMD is hardly affected by patients’ number of sample size, SMD is used to verify the difference in covariates after propensity score matching (Fig. 1 and 2).
5. Matching algorithm
There are many ways to actually do propensity score matching. One of them is selecting a matching method, which indicates a method of selecting a patient with X=0 that matches each patient in the group with X=1. The nearest neighbor matching method is to bring the X=0 patient with the closest propensity score to the current X=1 patients, among the remaining patients without thinking about future matchmaking.[18] It is also called greedy matching and is the most widely used method. Meanwhile, in consideration of all other patients, the sum of propensity score differences between each patient after matching may be minimized. This is called optimal matching. In addition, full matching and genetic matching can be used.
Some covariates may have to be matched more accurately than other covariates. For example, covariates such as age and gender are more important than other covariates in most cases. Matching is performed according to the specified algorithm, but in the case of these important specific covariates are included, gender for example, matching may be restricted to always having to match and bring only those with the same gender. This method is called exact matching.[19]
Once the matching method has been decided, the matching order should be determined. The matching order is the process of determining the order in which X=1 patient is to be first matched. The order may start with patients with small propensity score values, with large propensity score patients, or may be performed in a pre-numbered order. It is also possible to be performed in a random order.
6. Matching parameter
When matching is performed according to a predetermined matching algorithm, a maximum propensity score value difference between matched patients can be determined.[20] This parameter is called the caliper and basically marked as 0.x times the standard deviation, with about 0.2 standard deviation is the general rule. It may also be defined according to the absolute difference in propensity score, not the proportional value of standard deviation. When the caliper decreases, the number included in the matching decreases, but it becomes a more sophisticated matching.
When matching, it is common not to match again an X=0 patient that has already been matched with another X=1 patient. This is called without replacement. However, X=0 patients already matched with other X=1 patients can also be imported into the final matched cohort as duplicates. In this, a single X=0 patient may appear multiple times in the final matched cohort, and this method is called with replacement.
In most research data, the control group is generally easier to obtain than the treatment group. Therefore, several patients in the control group may be matched for one treatment group patient, which is the matching ratio. This value can be increased to 1:5 by increasing it from the standard 1:1 which helps to strengthen the power of statistics after matching. However, taking a very large value of the matching ratio (e.g., a value greater than 1:10) rarely results in a clear gain compared to the recommended level (1:3 to 1:5).
By adjusting the above parameters, it is possible to balance SMD and the number of final patients. Nevertheless, if researchers are not satisfied with the results, they can try again from scratch by changing the way they calculate the propensity score. This can be not only a logistic model, but also be chosen from all other regression and machine learning models, including general additive model and random forest.[21]
7. Propensity score weighting
Instead of equalizing the covariates of the treatment group and the control group through matching, it may be equalized by weighting based on the propensity score. This method uses weighted statistics after weighting each case, and almost all cases are utilized, which result in the preservation of the original n number. It also has the advantage of further reducing SMD more than matching. This advantage is particularly strong when the matching is not well performed (i.e., when SMD is large or n is greatly reduced).[22]
There are four most representative methods: (1) average treatment effect (ATE) weights 1/ps for the treatment group and 1/(1-ps) for the control group and is most commonly used; (2) average treatment effect on the treated (ATT) gives the treatment group a weight of 1 and the control group a weight of ps/(1-ps); (3) Overlap method, which has recently gained popularity with its emphasis on stable reproduction of RCT, gives the treatment group a 1-ps weight and the control group a ps weight; and (4) trapezoidal method focuses on minimizing SMD and can actually greatly minimizes SMD but is not widely used.[23]
8. After propensity score matching
If the number of n is accurately preserved while reducing the SMD of the two groups to the desired level through propensity score matching, further statistical analysis such as general RCT can be performed. In particular, when Cox regression analysis is used, bias can be reduced by defining the start of the observation of the control group as the start of the observation of the matched corresponding patient of the treatment group. In the case of using the weighting method, weight statistics can be used for all subsequent analyses. However, a method of bringing the observation start time of the matched treatment group as above cannot be used in weighting methods.[24]
9. Conclusion
Propensity score matching is a research methodology that can be useful when there are many variables that act as covariates in real-world data but are not to be included as independent variables. Matching allows to reach the result that covariates between the two groups are similar, and real-world data research can be refined close to RCT. The fact that researchers are able to construct the desired level of the cohort through compromise between SMD and n number makes the propensity score matching even more attractive. Weighting can leverage the entire patient and further reduces SMD, but it is counterintuitive and difficult to utilize some immortal time bias reduction methods. Regardless of the method chosen, it should lead to a proper follow-up research methodology such as Cox (or weighted Cox) regression when drawing a conclusion.