1. Introduction
Leukemia, a hematologic malignancy characterized by the abnormal proliferation of leukocytes, presents a substantial challenge to global healthcare.[1] According to the Global Cancer Observatory (2020), leukemia was ranked as the 15th most common cancer by incidence and the 11th by mortality worldwide.[2] Despite a declining trend in both age-standardized incidence and disability-adjusted life years (DALY) rates, owing to advancements in treatment protocols and targeted therapies, leukemia remains the most prevalent and lethal of all hematologic malignancies.[3]
Leukemia is categorized into four subtypes: acute lymphocytic leukemia (ALL), chronic lymphocytic leukemia (CLL), acute myeloid leukemia (AML), and chronic myeloid leukemia (CML), each distinguished by factors such as the rate of progression and the affected cell type.[4] This classification makes it challenging to accurately address the overall burden of leukemia, as the age groups and regions most affected can vary significantly depending on the specific subtype.[5] Therefore, a comprehensive analysis of all four subtypes is essential when evaluating the global burden of leukemia, an approach not yet undertaken by previous studies.[6]
This study provides the first comprehensive analysis of total leukemia and all five major subtypes using Global Burden of Disease Study (GBD) 2021 data, encompassing global, regional, and national trends from 1990 to 2021 and projecting burden through 2050. By integrating subtype-specific trends with comparative risk factor attribution, including high body mass index, tobacco use, and occupational exposures to benzene and formaldehyde, this study provides a detailed assessment of the preventable contributors to the global leukemia burden.
2. Methods
The Global Burden of Disease, Injuries, and Risk Factors Study (GBD) provides annually updated estimates, maintaining methodological consistency and comprehensive geographic coverage within a unified analytic framework. We utilized estimates from GBD 2021 to examine the global burden of leukemia from 1990 to 2021 across 204 countries. Estimates of incidence, mortality, and DALYs were stratified by age, sex, location, and Socio-demographic Index (SDI). All analyses were conducted in accordance with the Guidelines for Accurate and Transparent Health Estimates Reporting (GATHER).[7] Statistical analyses were performed using Python (version 3.9.15; Python Software Foundation) and R software (version 4.3.3; R Foundation, Austria).[8]
In GBD 2021, incidence, prevalence, and disability were estimated for all cancers and benign neoplasms, as defined by International Classification of Diseases (ICD) 9 /10 codes (C00–D49). For this study, we used estimates for total leukemia and its subtypes, including ALL, CLL, AML, CML, and other leukemia.[9] The corresponding ICD-9/10 codes for total and subtype-specific leukemia are listed. As in previous GBD studies, leukemia prevalence was estimated for up to ten years following incidence. To assess disability, total prevalence was stratified into four sequelae: (1) diagnosis and primary therapy phase; (2) controlled phase; (3) metastatic phase; and (4) terminal phase.
The GBD cause of death (CoD) database incorporates cancer mortality data from multiple sources, vital registration systems, verbal autopsies, and cancer registries.[10] In cases where only incidence data were available, mortality estimates were derived using modeled mortality-to-incidence ratios (MIRs).10 Likewise, cancer incidence was estimated from mortality using corresponding MIRs where only mortality data were available.11
MIRs for most cancers, including leukemia, were estimated using a three-step modelling strategy based on the general GBD spatiotemporal Gaussian process regression (ST-GPR) approach.[10] MIR values were first logit-transformed and modeled as the outcome variable in a linear mixed-effects model, with sex, categorical age group, and healthcare access and quality (HAQ) index as covariates.[10, 11] Outputs from the final linear model were subsequently used as inputs for the ST-GPR to generate MIR estimates across all combinations of age, sex, year, cause, and location.[10] These MIR estimates were applied to the cleaned cancer registry dataset to generate mortality estimates, which were further smoothed using a Bayesian noise-reduction algorithm to account for zero counts.[10] In the non-fatal burden estimation, cancer-specific mortality estimates followed the general cause of death ensemble model (CODEm) process, incorporating data from verbal autopsy, vital registration, and cancer registries.[10, 12] For all cancers including leukemia, the final mortality estimates, after CoDCorrect adjustment, were then converted to incidence estimates using cancer-specific MIRs.[12] As both the fatal and non-fatal burden estimates rely on MIRs.
GBD 2021 evaluates potential reductions in health burden by comparing observed population exposures to theoretical minimum risk exposure levels (TMREL). Initial exposure estimates were obtained from population-representative surveys and surveillance systems, then refined using ST-GPR to improve geographic and temporal integration.[13] Population attributable fractions were calculated using the GBD comparative risk assessment methodology, which incorporates risk exposures, meta-analysis-derived relative risks, and TMRELs as baseline counterfactuals for each risk-disease pair.[13, 14] Summary exposure values reflected risk-weighted prevalence adjustments, accounting for mediating pathways between interconnected risk factors. These fractions, stratified by age, sex, region, and year, were applied to disease-specific mortality and morbidity estimates to quantify attributable deaths and DALYs. In GBD 2021, high body mass index, tobacco use, and occupational exposure to benzene and formaldehyde were identified as contributing risk factors for all leukemia types within the analytical framework.
Projections for cause-specific mortality, years of life lost (YLLs), years lived with disability (YLDs), and DALYs by age and sex from 2022 to 2050 were generated using data from GBD 2021. The analysis was performed at the cause-specific level, incorporating only risk factors with established causal relationships, as defined by the GBD comparative risk assessment.[15] Future cause-specific mortality was estimated using mixed-effects models, with SDI and time as key covariates, and the impact of each relevant risk factor was adjusted through an offset parameter.[15] Unexplained residual variation in all-cause mortality was modeled separately using an autoregressive integrated moving average approach with drift attenuation. A cascading mortality model was applied for cause-specific projections, employing the structured framework of the sequential GBD cause hierarchy to refine cause-specific estimates at progressively deeper levels, ensuring robust cause-specific mortality outcomes.[15] For non-fatal burden, incidence and prevalence forecasts were generated using SDI-based mixed-effects models, and YLDs were calculated by applying average disability weights derived from GBD to the projected prevalence.[15]
Age-standardized rates were calculated as weighted averages of age-specific rates, using the age distribution of the GBD global population standard as the weighting reference. Mortality estimates, generated as 1000-draws, were divided by MIR estimates to produce 1,000 corresponding draws of incidence, from which mean incidence values with 95% uncertainty intervals (UIs) were derived.[12] All leukemia burden estimates, including incidence, mortality, and disability-adjusted life years, were reported with 95% uncertainty intervals (UIs). These intervals were calculated by taking the 2.5th and 97.5th percentiles of the distribution of each estimate and presented alongside their respective mean values.[16]
3. Results
Fig. 1 illustrates the age-standardized incidence, mortality, and DALY rates of leukemia across 204 countries. Between 1990 and 2021, global age-standardized incidence rates for total leukemia decreased by 18.3% (95% UI, -26.3 to -9.1) from 6.9 (6.2 to 7.5) per 100,000 population in 1990 to 5.6 (4.8 to 6.2) per 100,000 population in 2021. Regionally, high SDI regions such as Australasia and High-income North America showed the highest age-standardized incidence rate in 2021 at 10.6 (9.7 to 11.6) and 9.8 (9.1 to 10.2) per 100,000 population, respectively. In contrast, Western Sub-Saharan Africa had the lowest in 2021 at 1.2 (0.7 to 1.5). Notably, High-income North America exhibited the largest percentage decrease over the same period, with a reduction of 26.9% (-29.4 to -25.0).
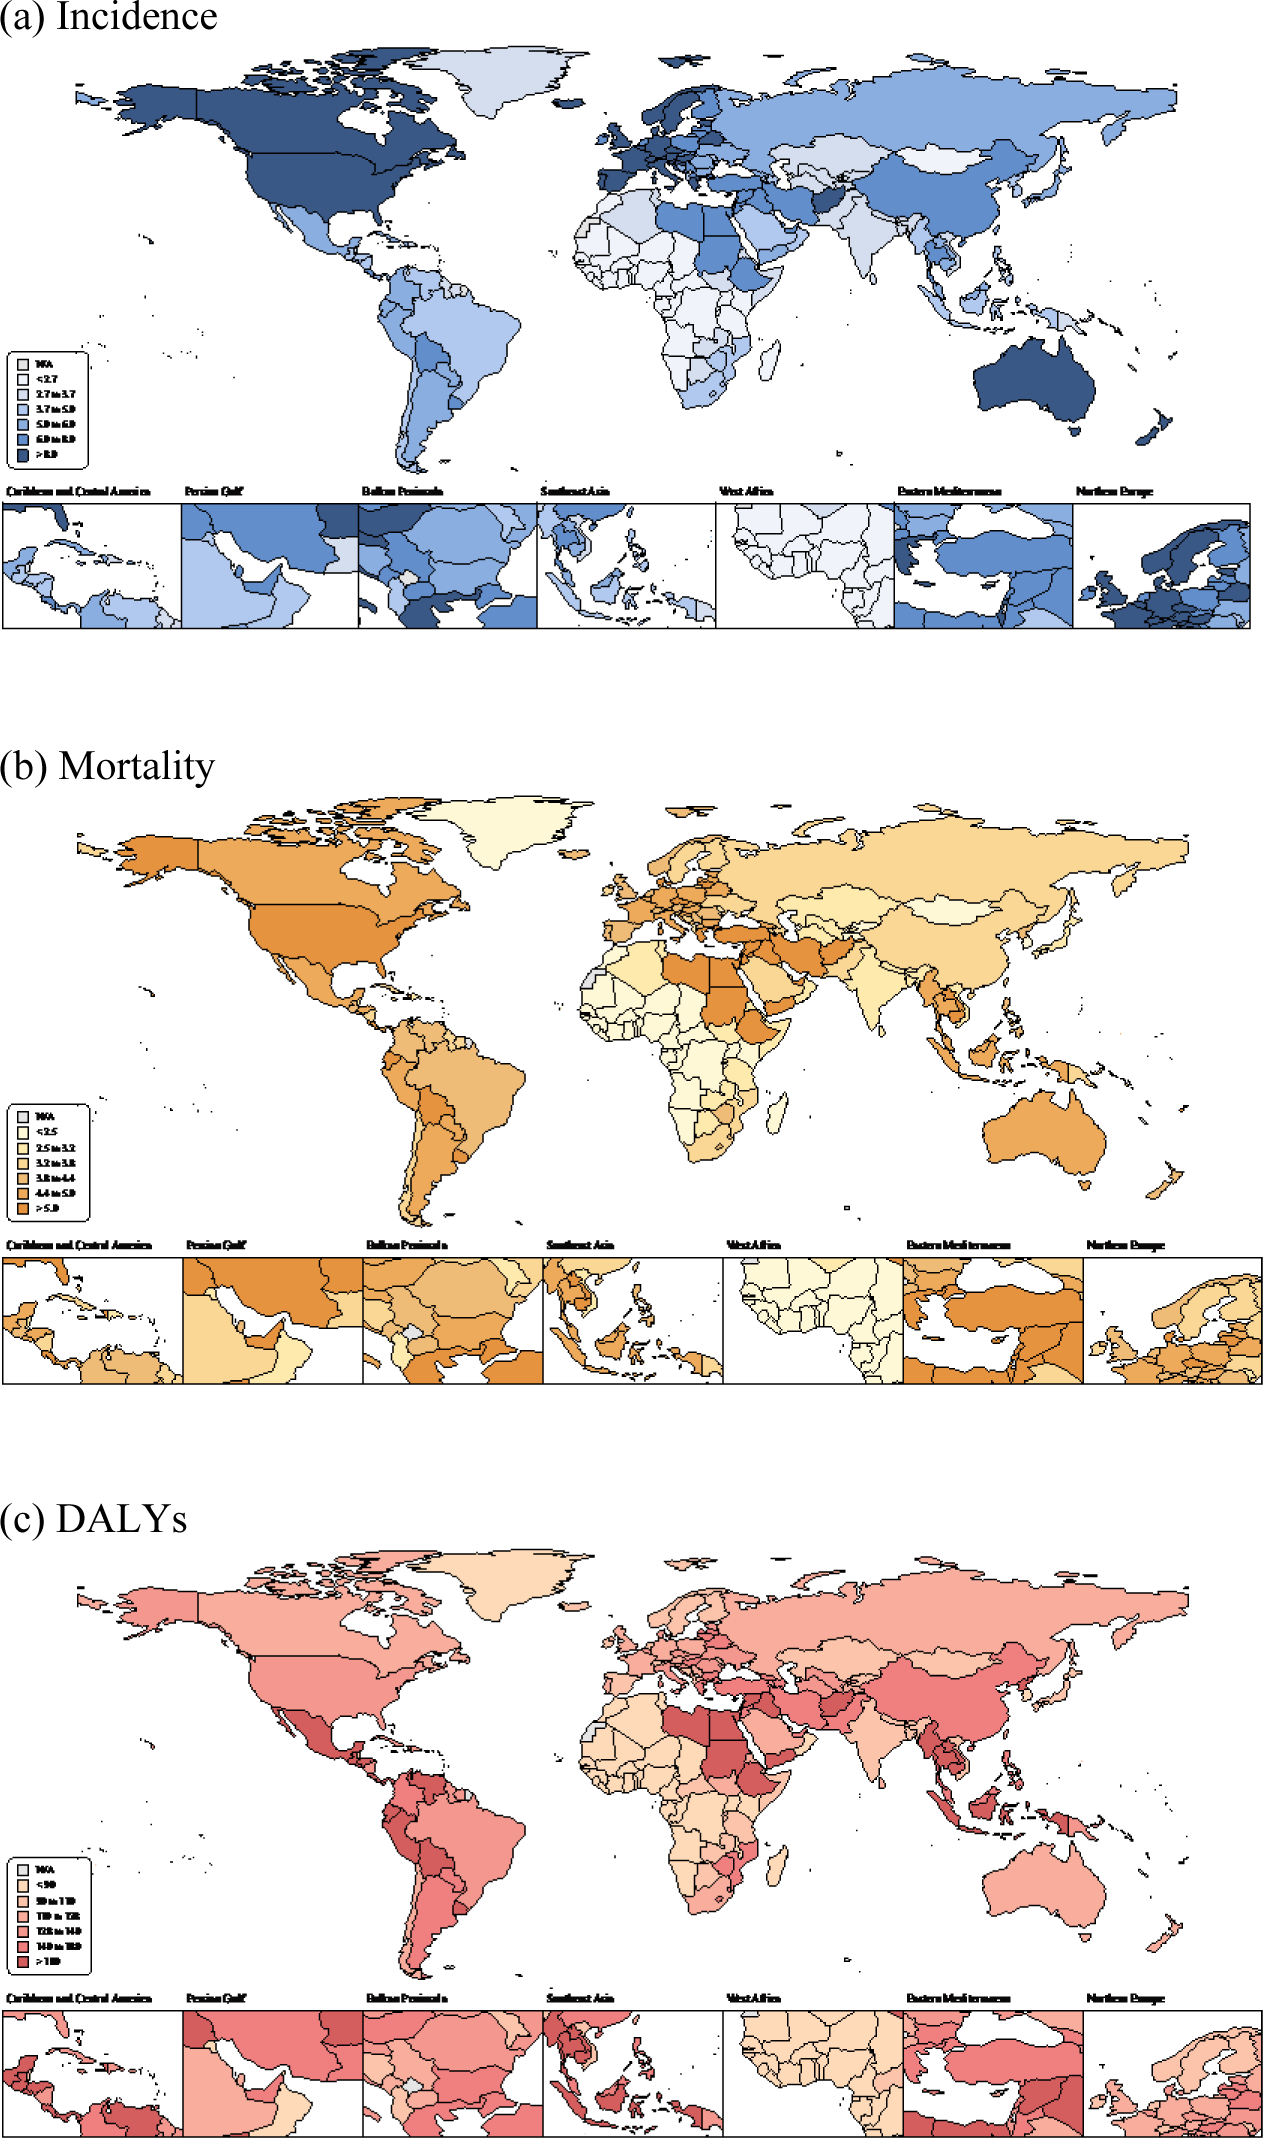
Similarly, global age-standardized mortality rates for leukemia also had a notable decline, with a 30.0% (-36.0 to -23.3) reduction from 5.6 (5.0 to 6.1) per 100,000 population in 1990 to 3.9 (3.3 to 4.2) in 2021. East Asia experienced the most significant decrease in mortality, at 46.0% (-55.7 to -30.5). A similar trend was observed in age-standardized DALY rates, which decreased by 39.5% (-47.0 to -29.6), with East Asia showing the largest decrease of 55.1% (-64.4 to -40.9). Andean Latin America had the highest age-standardized DALY rate in 2021 at 205.5 (151.3 to 253.2) per 100,000 population while Western Sub-Saharan Africa exhibited the lowest in 2021 at 50.6 (28.9 to 66.8).
When analyzed by specific causes, age-standardized incidence rates generally remained stable for most leukemia subtypes, but CML showed a significant decline of 54.6% (-60.7 to -45.4). CML also exhibited the largest reduction in age-standardized mortality rates at 61.1% (-67.1 to -52.3), followed by ALL at 42.1% (-56.2 to -25.9) decrease. A similar trend was observed in age-standardized DALY rates, where CML decreased by 63.5% (-70.9 to -52.2) and ALL by 48.5% (-62.6 to -32.4) (Fig. 2).
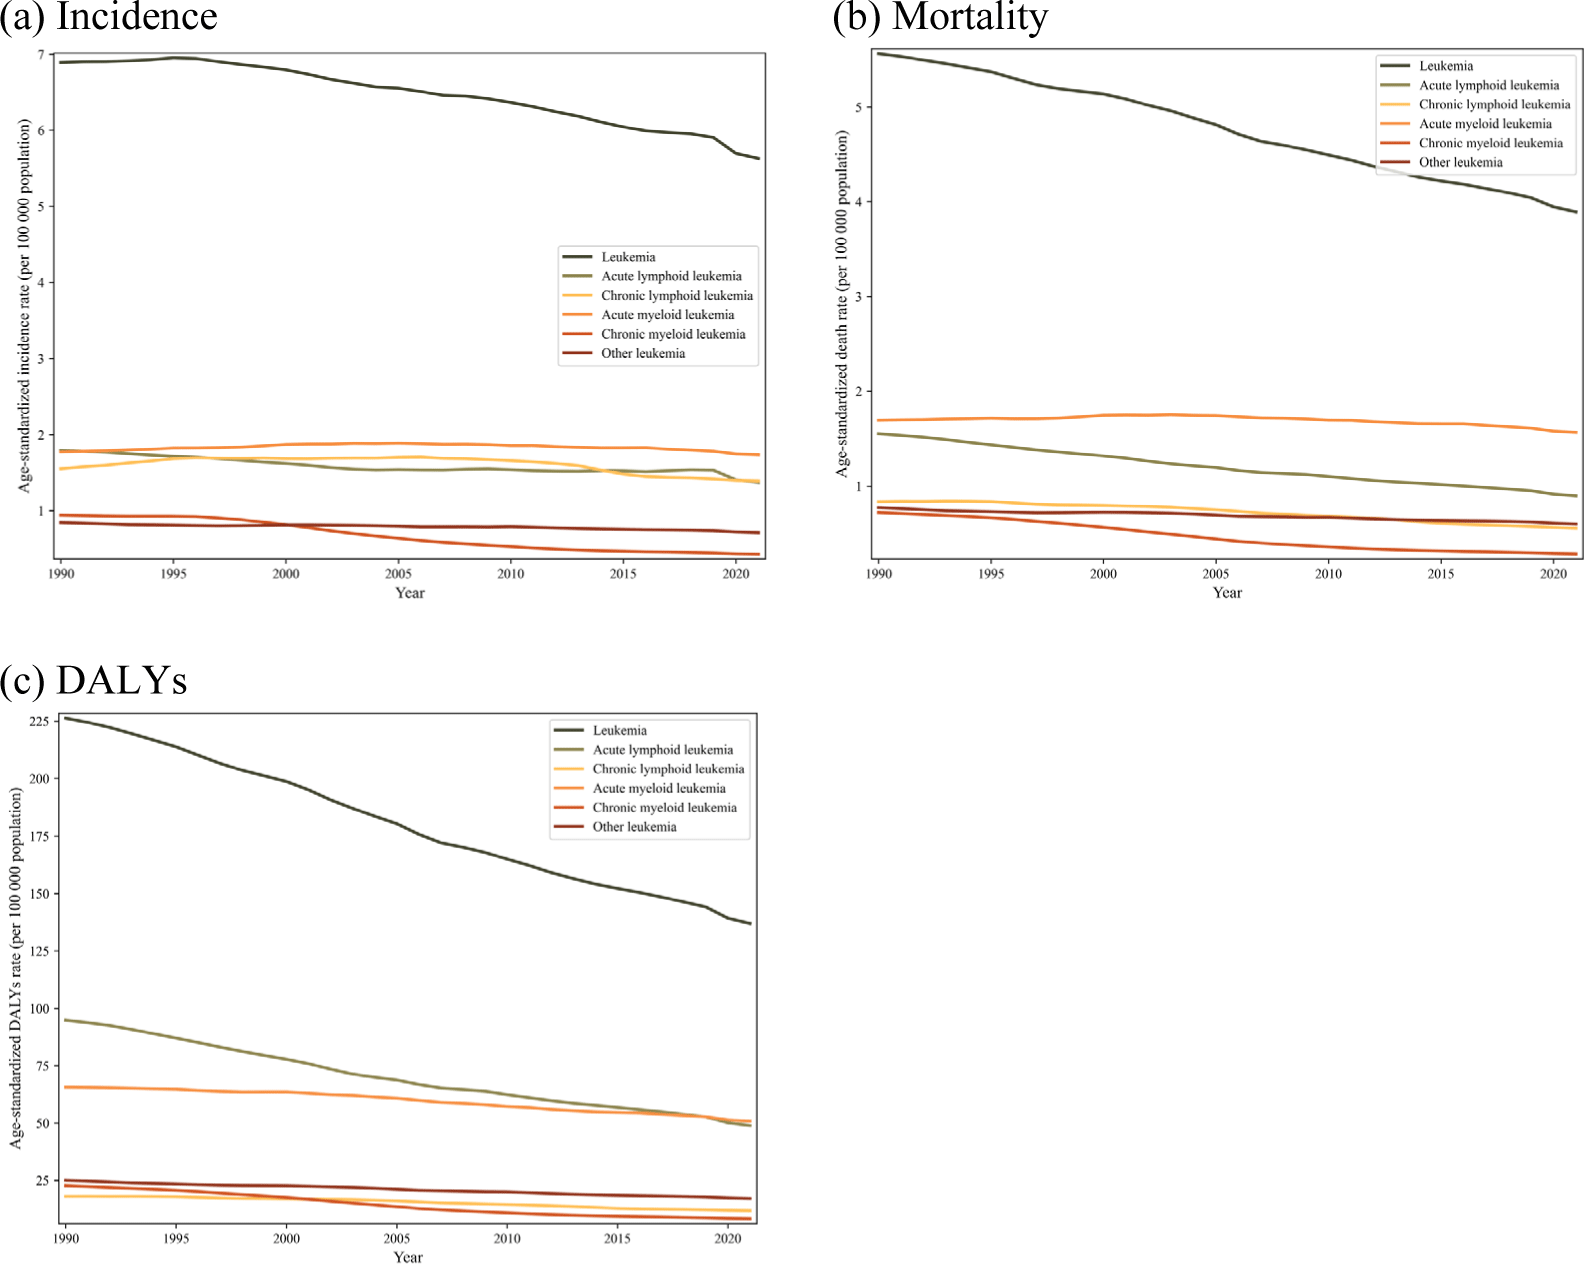
Fig. 3 illustrates the age-standardized incidence and mortality rates of leukemia and its subtypes, stratified by age and sex. Across most age groups, males exhibited higher incidence and mortality rates than females for all leukemia subtypes, with the disparity increasing with age (Fig. 3). Regarding the age group analysis, the age-standardized incidence and mortality rates for most leukemia subtypes progressively increased with age, peaking after 90 years. However, ALL showed a distinct pattern, with the highest incidence rate occurring in children aged five years and younger (3.8 [95% UI, 2.3 to 5.3] per 100,000 population) (Fig. 3).
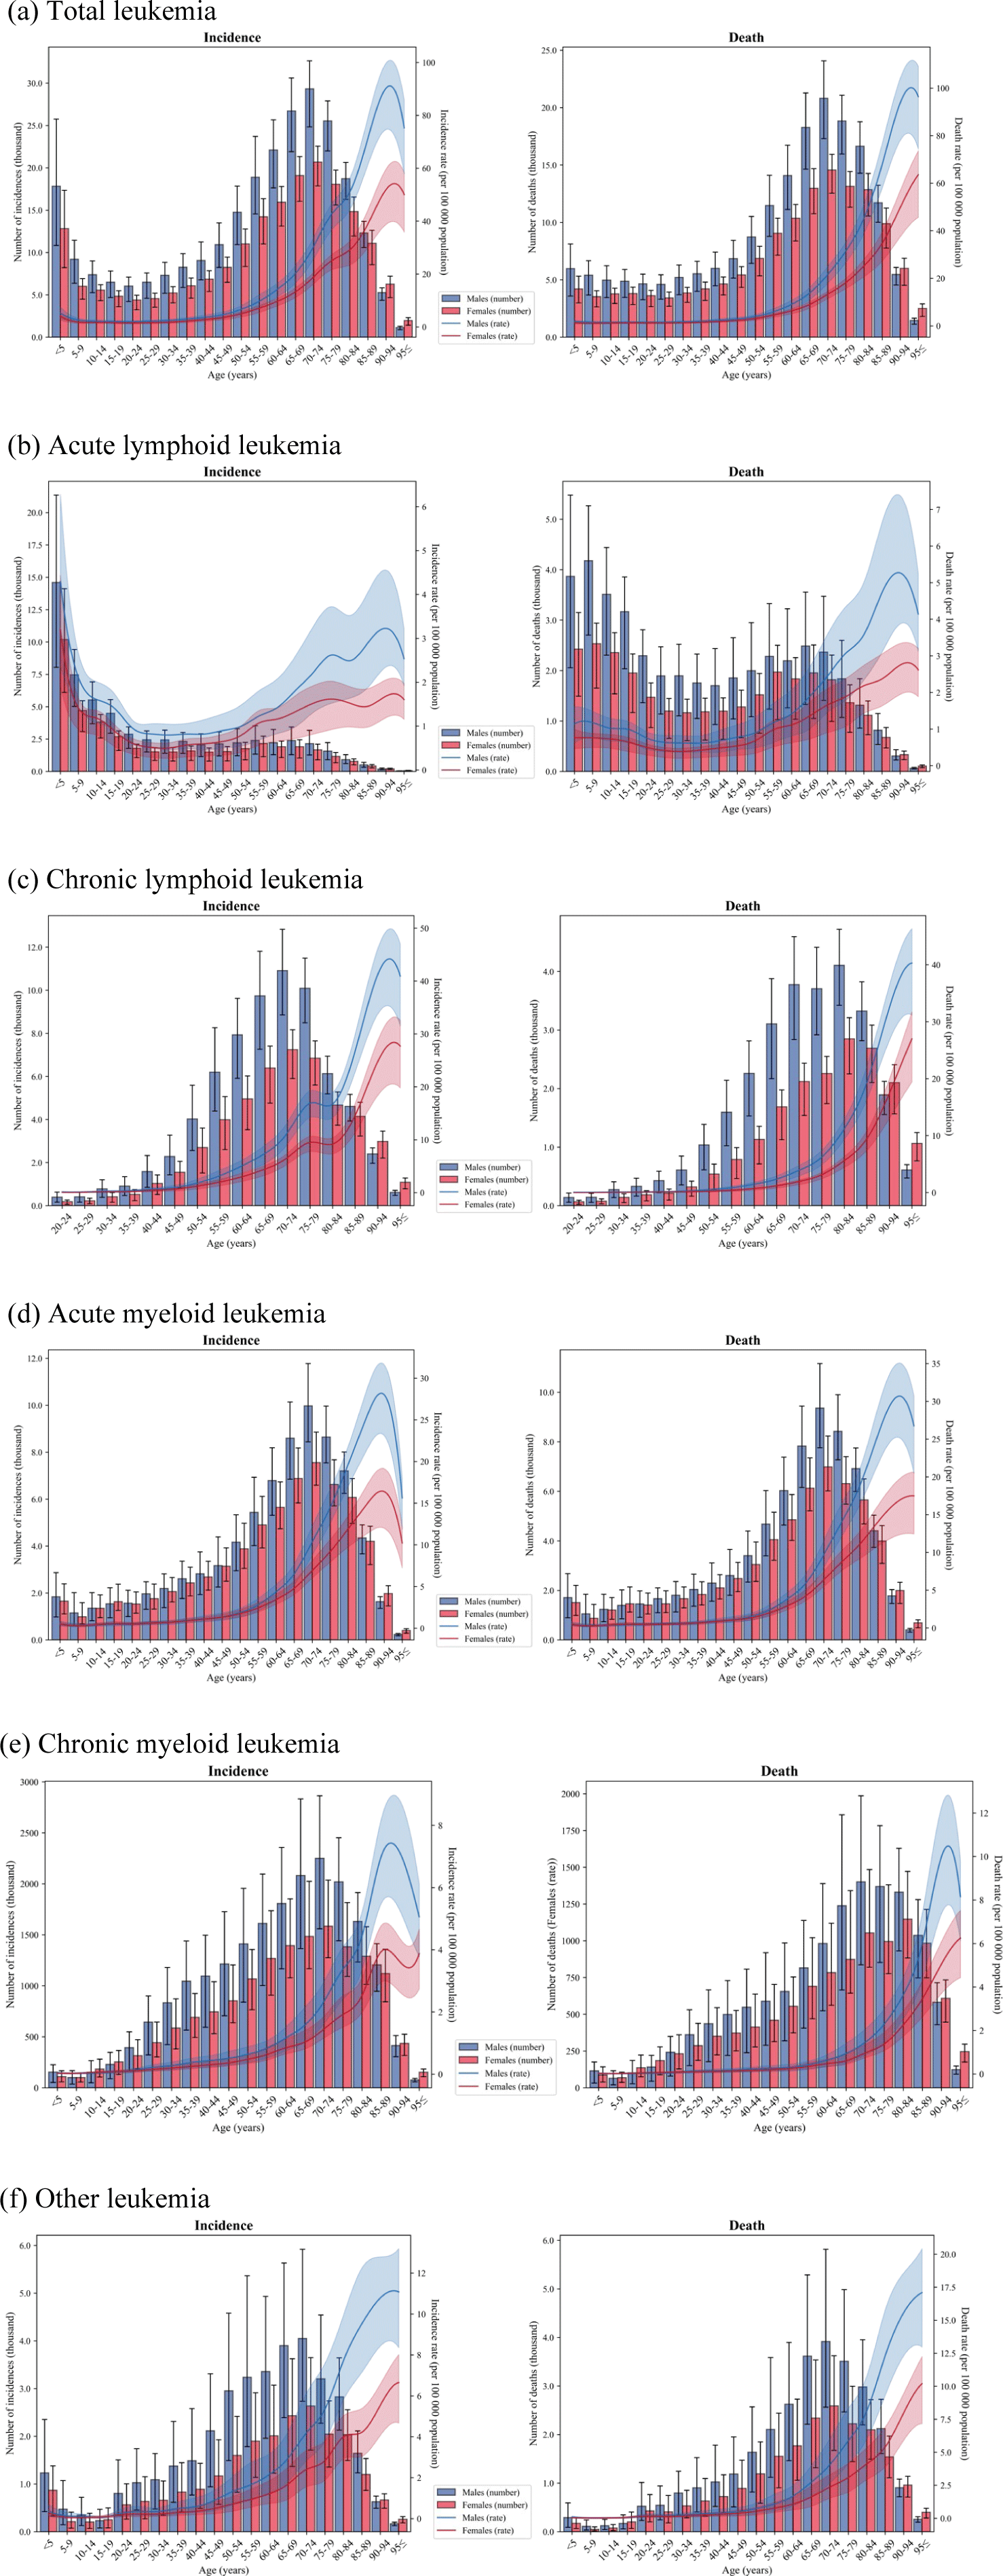
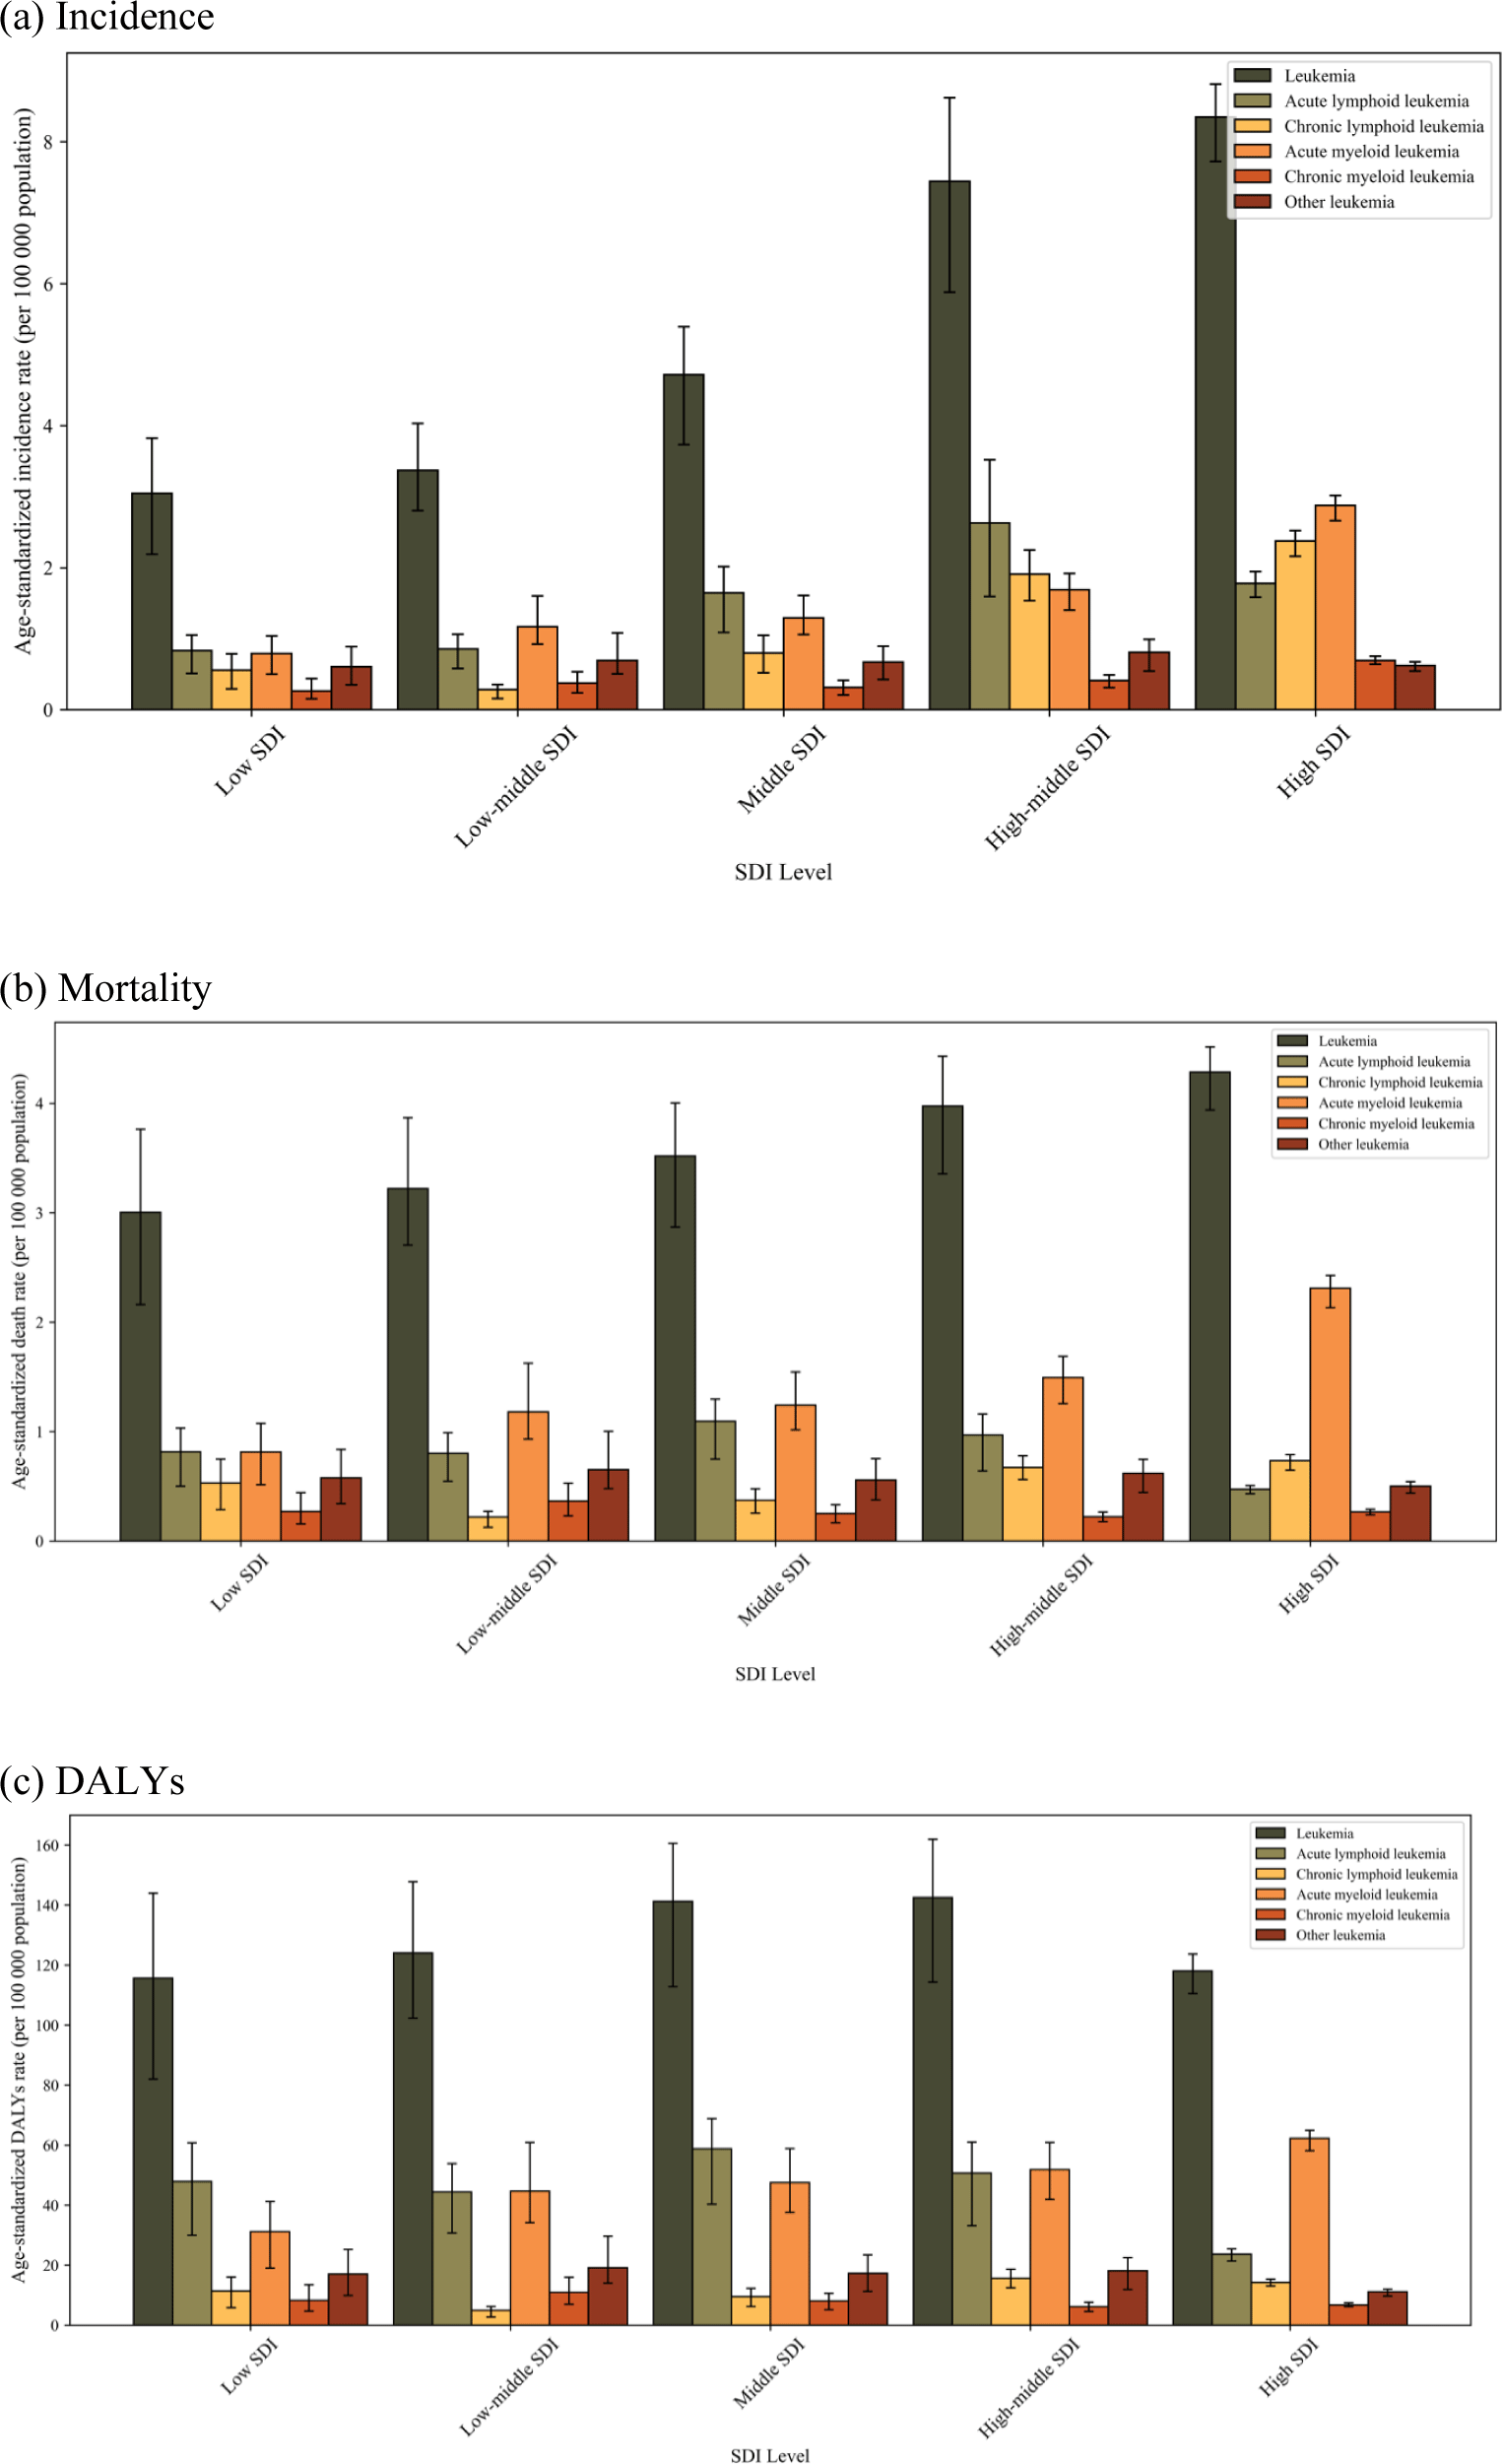
Fig. 4 presents the age-standardized incidence, mortality, and DALY rates for leukemia and its subtypes, categorized by SDI. Countries with higher SDI levels showed notably higher incidence and mortality rates for leukemia, especially for AML. Incidence rates ranged from 0.8 (95% UI, 0.5 to 1.0) per 100,000 population in low-SDI countries to 2.9 (2.7 to 3.0) in high-SDI countries. Mortality rates followed a similar pattern, from 0.8 (0.5 to 1.1) per 100,000 population in low-SDI countries to 2.3 (2.1 to 2.4) in high-SDI countries. The age-standardized incidence, mortality, and DALY rates for ALL initially increased with higher SDI levels but showed a significant decline when transitioning from high-middle to high SDI. Specifically, the incidence rate decreased from 2.6 (1.6 to 3.5) per 100,000 population to 1.8 (1.6 to 1.9), mortality rate from 1.0 (0.6 to 1.2) to 0.5 (0.4 to 0.5), and DALY rates from 50.7 (33.1 to 61.0) to 23.7 (21.4 to 25.5). The age-standardized DALY rate for total leukemia displayed an inverted U-shaped pattern, with acute subtypes contributing most to the overall leukemia burden.
The DALY rates associated with each risk factor, stratified by SDI, are displayed in Fig. 5. Among the four major leukemia subtypes, AML showed the strongest association with preventable risk factors such as high body mass index (3.8 [95% UI, 2.8 to 4.9] per 100,000 population), smoking (3.6 [1.3 to 6.1]), and occupational exposure to benzene (0.4 [0.1 to 0.7]). High body mass index was the leading global risk factor for total leukemia (8.7 [6.6 to 11.2] per 100,000 population), with some exceptions in high-SDI countries for certain subtypes, driven primarily by its contribution to ALL (1.8 [1.2 to 2.4]), AML (3.8 [2.8 to 4.9]), and CML (0.7 [0.5 to 0.9]). In contrast, smoking remained the primary risk factor globally for CLL (1.7 [0.6 to 2.9] per 100,000 population) and other leukemia (1.4 [0.5 to 2.4]) subtypes. Occupational exposures to carcinogens have had minimal impact and showed no significant variation across leukemia subtypes or SDI levels, particularly regarding formaldehyde.
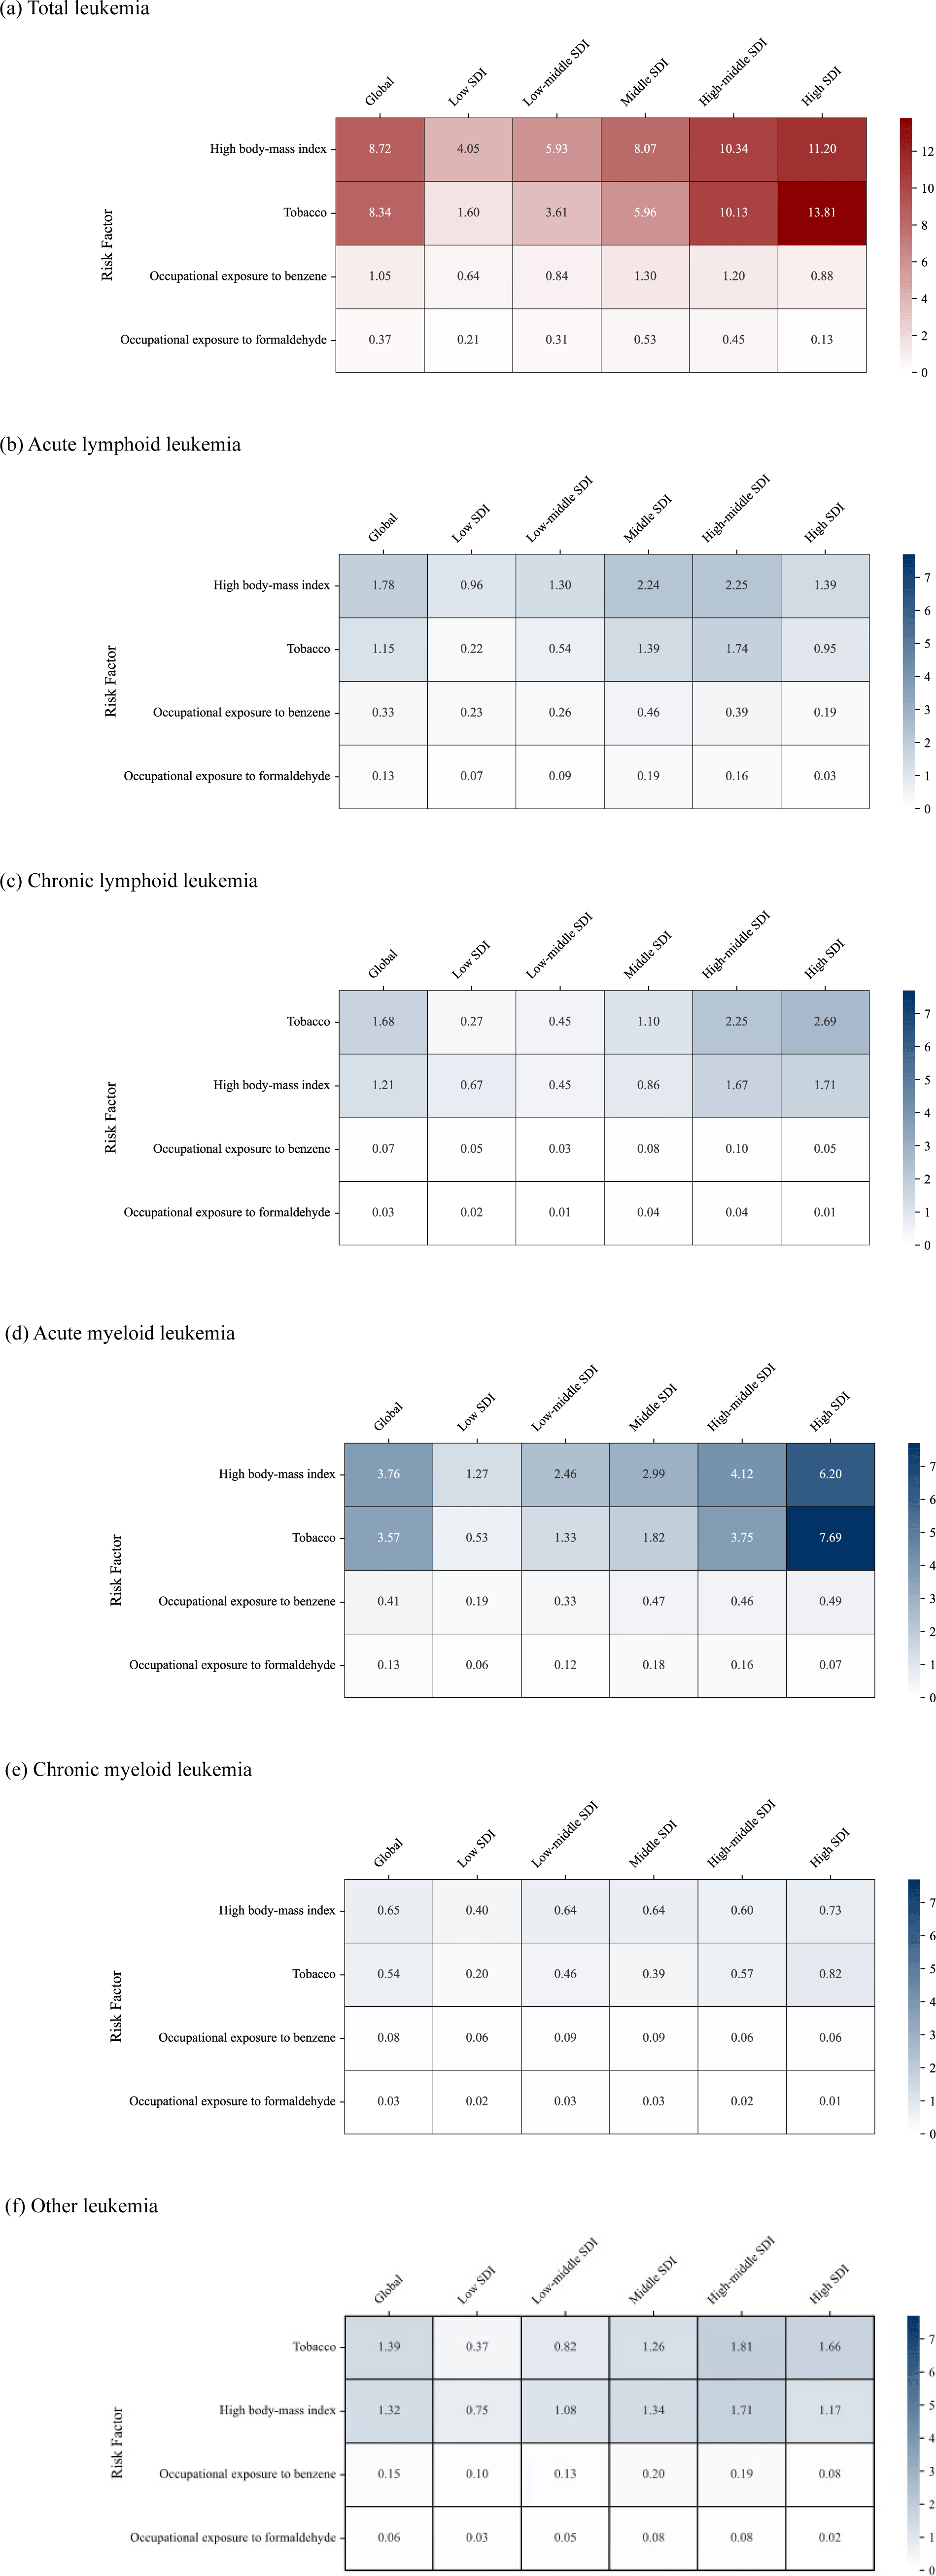
Fig. 6 presents the projected burden of leukemia and its subtypes up to 2050. The age-standardized DALY rate for total leukemia is expected to remain relatively stable, from 136.9 (95% UI, 111.9 to 153.7) per 100,000 population in 2021 to 140.2 (115.2 to 170.8) by 2050. Most subtypes also show stable trends. For ALL, the rate is projected to change from 48.9 (34.2 to 57.5) per 100,000 population to 36.5 (25.0 to 46.9), for AML from 50.8 (42.2 to 60.4) to 61.6 (49.4 to 77.5), for CML from 8.3 (5.9 to 10.6) in 2021 to 6.4 (4.1 to 9.1), and for other leukemia from 17.2 (12.1 to 22.5) to 17.3 (12.2 to 23.4). In contrast, CLL is the only subtype projected to increase, with the rate rising from 11.8 (9.3 to 13.5) per 100,000 population in 2021 to 18.5 (12.6 to 25.5) in 2050.

4. Discussion
We investigated the global and regional burden of leukemia using estimates from the GBD 2021. From 1990 to 2021, age-standardized incidence, mortality, and DALY rates declined across all subtypes, with the greatest reduction in CML. Males consistently exhibited higher age-standardized incidence and mortality rates than females across all leukemia subtypes, and rates increased with age, except for ALL, which peaked in children under five years. Higher SDI countries experienced a greater burden, particularly for AML, while rates for ALL showed a distinct decrease in high SDI countries. The age-standardized DALY rate for total leukemia displayed an inverted U-shaped pattern across SDI levels, with acute subtypes contributing most. High body mass index was the leading modifiable risk factor for ALL, AML, and CML, and rates attributable to high body mass index are steadily rising. Smoking remained the dominant risk factor for CLL and other subtypes. CLL is the only subtype projected to increase in DALY burden by 2050, underscoring the need for subtype-specific prevention and long-term care strategies.
From 1990 to 2021, age-standardized incidence, mortality, and DALY rates for leukemia have significantly declined across all subtypes, likely due to advancements in early detection and treatment. Acute leukemia subtypes, due to their rapid progression and aggressive treatments, accounted for the highest proportions of these measures.[17] Notably, the age-standardized incidence rate for CML sharper decline after 2001, following the World Health Organization’s redefinition of CML to require the presence of the BCR-ABL fusion gene.[18] This change, along with the introduction of tyrosine kinase inhibitors like Imatinib in the same year, significantly reduced mortality and DALY rates for CML.[19]
Higher age-standardized leukemia incidence rates in high-SDI countries in 2021 reflect an aging population, while lower rates in low-SDI countries are due to underreporting and limited diagnostics. The increased age-standardized mortality rate for total leukemia in higher SDI countries is also associated with an aging population, especially in AML, where the disease’s aggressive nature leads to higher mortality in older individuals.[20] In contrast, ALL shows relatively low mortality rates despite its high incidence rate in high-SDI countries, likely due to advancements such as chimeric antigen receptor-T-cell therapies, which has improved remission and survival.[21]
Among the four major leukemia subtypes, AML showed the highest age-standardized DALY rates attributable to preventable risk factors. Chemical exposure, high body mass index, and smoking are well-established risk factors for AML, consistent with our findings. In contrast, for CLL, age, sex, race, and family history are more significant, while genetic predispositions are central in ALL.[22] CML is primarily driven by the BCR-ABL fusion gene, with limited environmental influence.[23] Therefore, policies targeting risk factor control are likely to have the greatest impact in reducing the burden of AML.
Since 1990, the age-standardized DALY rate of leukemia and its subtypes linked to high body mass index has steadily increased in lower-SDI countries, due to rising processed food consumption and reduced physical activity.[24] Meanwhile, the smoking-related burden has significantly declined across all SDIs and leukemia subtypes. While smoking remains the primary risk factor for myeloid subtypes in high-SDI countries, high body mass index is contributing an increasing share of the burden and may become more prominent if current trends continue. Therefore, future policies on leukemia should prioritize addressing obesity, while continuing effective tobacco control measures. The age-standardized DALY rate of leukemia attributable to occupational carcinogen exposure in lower-SDI countries has also gradually increased since 1990. This trend is likely driven by the industrialization of these countries, which has led to greater exposure to hazardous substances. For example, a study in Pakistan found a positive correlation between blood benzene levels and factors such as workplace hygiene, ventilation, and working hours in high-risk environments.[25] Thus, policies should focus on promoting the use of less harmful substances and enforcing stricter safety standards in high-risk work environments in lower-SDI countries.
This study is the first to systematically analyze the regional burden of all five leukemia subtypes using the GBD 2021, with forecasts up to 2050. However, several limitations should be noted. First, certain well-established risk factors for leukemia were not included in GBD 2021 due to challenges in data collection, standardization, and individual variability. For example, genetic abnormalities such as BCR-ABL fusion in CML, as well as with family history or radiation exposure, were not considered.[23] The exclusion of these factors may limit the development of more targeted interventions. Second, GBD 2021 does not distinguish between specific leukemia subtypes. For example, ALL includes both B-cell and T-cell subtypes, which differ in prevalence between children and adults. A clearer classification of these subtypes would have improved the analysis of ALL burden across age groups and provided valuable insights for policymaking. Similarly, rarer leukemia types, such as hairy cell, plasma cell, and eosinophilic leukemia, were grouped under the broader category of “other leukemia”.[26] Third, some leukemia subtypes, particularly chronic forms, are gradually progressive and are often asymptomatic in their early stages, leading to potential under-estimation of their true burden. Fourth, limited diagnostic resources, especially in low-SDI countries, may have contributed to a reporting bias. Finally, this study assessed the global burden of leukemia across different SDIs and regions without delving into individual countries. Incorporating country-specific data would provide a more comprehensive understanding of the disease burden.
Despite these limitations, this study offers several key strengths. We assessed the age-standardized incidence, mortality, and DALY rates of leukemia burden, allowing a multifaceted assessment of the leukemia burden. Additionally, we estimated the leukemia burden attributable to specific risk factors using the GBD 2021 comparative risk assessment framework, calculating population attributable fractions based on relative risks estimation approach. Furthermore, it presents updated findings that diverge from GBD 2019 and projects trends through 2050, offering critical insights for future policymaking.
5. Conclusion
This study offers the first comprehensive assessment of the global burden of total leukemia and all five subtypes, expanding previous GBD analyses with subtype-specific trends, risk factor attribution, and forecasts up to 2050. Although the overall burden has declined, leukemia remains a leading cause of hematologic cancer-related morbidity and mortality, particularly in high-SDI regions and older populations. The rising contribution of modifiable risk factors, most notably high body mass index, and the projected rise in CLL burden highlight the need for investment in targeted prevention, risk factor control, and accessible long-term care systems. These findings provide a critical foundation for future global leukemia control strategies.
