State-of-the-Art Reviews
Age, ethnic, and sex disparity in body mass index and waist circumference: a bi-national large-scale study in South Korea and the United States
Seounghyun Eum
1, Sang Youl Rhee
2,*
1Department of Medicine, Kyung Hee University College of Medicine, Seoul, Republic of Korea
2Department of Endocrinology and Metabolism, Kyung Hee University College of Medicine, Seoul, Republic of Korea
© Copyright 2023 Life Cycle. This is an Open-Access article distributed under the terms of the Creative Commons Attribution Non-Commercial License (http://creativecommons.org/licenses/by-nc/4.0/) which permits unrestricted non-commercial use, distribution, and reproduction in any medium, provided the original work is properly cited.
Received: Jan 15, 2023; Revised: Feb 19, 2023; Accepted: Feb 24, 2023
Published Online: Feb 27, 2023
Abstract
The study investigated age, ethnic, and sex disparities in body mass index (BMI) and waist circumference (WC) in South Korea and the United States. We conducted a bi-national large-scale study and analyzed data from the Korea National Health and Nutrition Examination Survey (KNHANES) and the National Health and Nutrition Examination Survey in the United States (NHANES). The study found significant differences in BMI and WC between the two countries, as well as within each country based on age, ethnic, and sex groups. In both countries, men had higher BMIs and WCs than women. Among ethnic groups in the United States, non-Hispanic Black individuals had the highest BMIs and WCs, while Mexican American individuals had the highest BMIs and WCs in the South Korean population. The study also found that age was associated with higher BMIs and WCs in both countries, with the highest BMI and WC observed in the 60-69 age group in both South Korea and the United States. Additionally, the study revealed that the prevalence of obesity was higher in the United States than in South Korea, while abdominal obesity was more prevalent in South Korea than in the United States. Overall, the study suggests that there are significant differences in BMI and WC across age, ethnic, and sex groups in both South Korea and the United States, highlighting the importance of considering these factors in efforts to prevent and address obesity and its associated health risks.
Keywords: obesity; abdominal obesity; body mass index; waist circumference; ethnicity; age; sex
1. Introduction
Obesity is a major public health concern because it is common worldwide and has a broad impact on human health.[1] Obesity increases the risk of non-communicable diseases (i.e., type 2 diabetes mellitus[1], cardiovascular disease[2], hypertension, and kidney disease[3]) and mental illness (e.g., depression[4], substance abuse[5], and schizophrenia[6]) and is associated with higher mortality rates[7]. According to previous studies, many government agencies, including the Centers for Disease Control and Prevention (CDC) in the United States (US), provided estimates of some weight-related measures (height, weight, and waist circumference [WC]) may improve public health.[7]
General obesity and abdominal obesity were defined based on the specific cutoff values for body mass index (BMI) and WC, respectively. BMI is a composite random variable defined by body mass and height and is calculated as follows:
where M is a person’s mass in kg and H is the corresponding height in meters. The CDC and World Health Organization (WHO) define an adult with BMI values of >25 kg/m2 as overweight and >30 kg/m2 as obese. Children with a BMI above the 85th percentile were considered overweight, while those with a BMI above the 95th percentile were considered obese.[8]
Meanwhile, WC has been associated with high levels of symptoms caused by weight gain, independent of the BMI. There was a criterion for central obesity.[9] Inflammatory markers[10], insulin resistance,[11] type 2 diabetes mellitus[12], dyslipidemia[13], and coronary heart disease[14] are strongly linked to obesity. These conditions are associated with WC because it is highly correlated with the visceral adipose tissue, which is thought to be more pathogenic than the subcutaneous adipose tissue.[15] CDC defines abdominal obesity or central obesity as a WC exceeding 102 cm (40 inches) in men and a WC exceeding 88 cm (35 inches) in non-pregnant women.[9] For children, a WC above the 90th percentile is the criterion for abdominal obesity.[16] Other countries, including Japan and China, define it using other numerical values (Japan: 85 cm for men and 78 cm for women 78 cm; China: 85 cm for men and 82 cm for women).[9]
The criteria for general and abdominal obesity in children were defined based on the percentile of BMI and WC. This is because their BMI and WC distributions differed significantly in terms of growth. Similarly, BMI and WC differ according to race, age, and sex. In addition, even if one has the same BMI and WC, the onset rate or prognosis of weight-related diseases varies.
Considering the statements above, defining obesity collectively based on the WC, regardless of sex, race, and age, cannot reflect the degree of obesity risk. For example, people with high muscle mass have a high WC despite their less likelihood of developing weight-related diseases.[9] Therefore, defining obesity using the optimal WC cutoff values for all people is old-fashioned. In effect, almost half of the US population is obese or abdominally obese according to the existing criteria. This may result in unawareness of obesity among people.
Thus, we aimed to investigate the percentiles of BMI and WC in groups divided based on age-, sex-, and ethnicity-disparity. Furthermore, we provide reference data for assessing the cut-off value of BMI and WC.
2. Results
We used the population-based, large-scale studies from the US National Health and Nutrition Examination Survey (NHANES) and the Korea NHANES (KNHANES).[17-20]
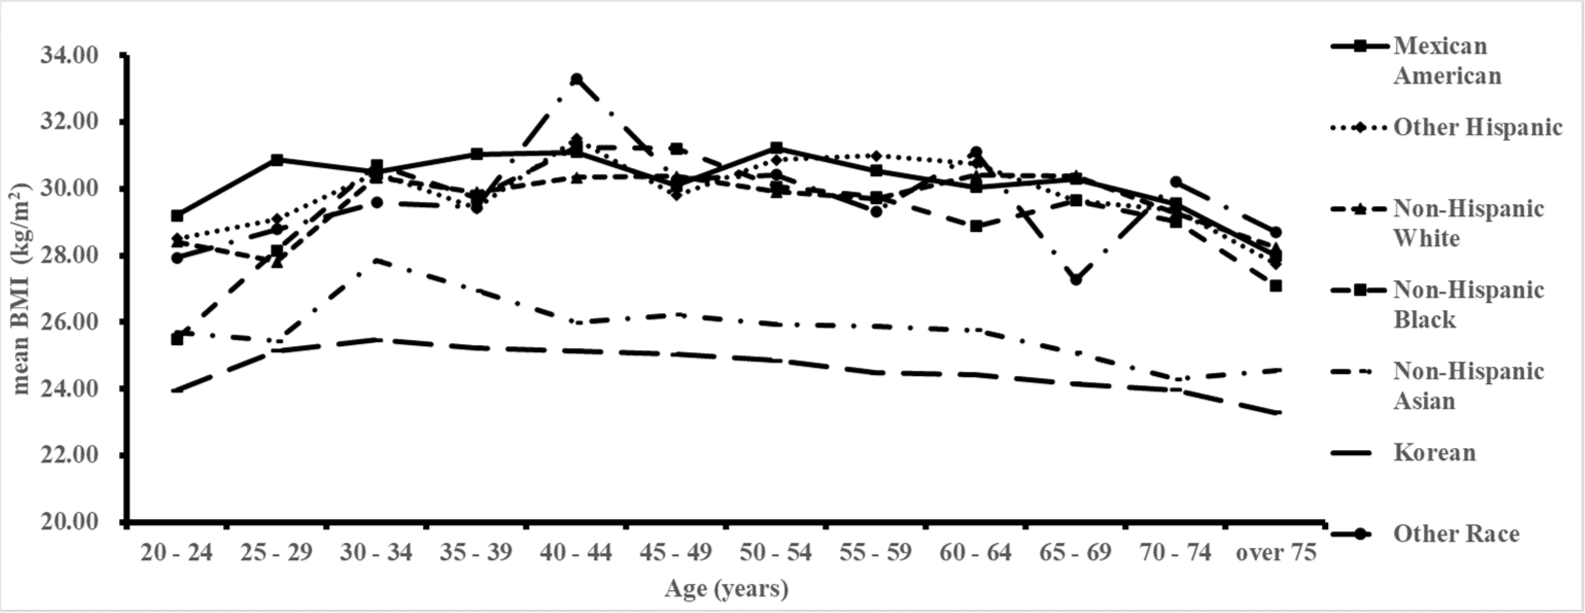
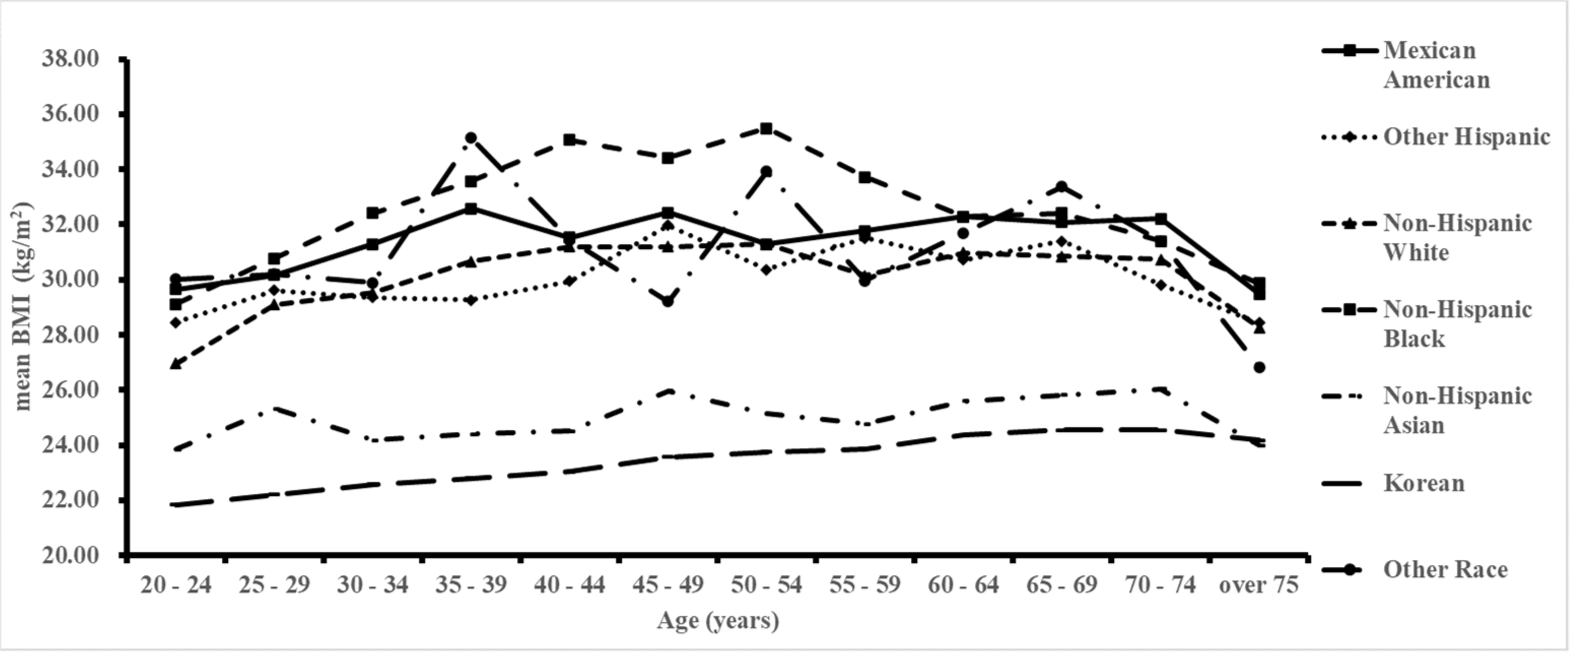
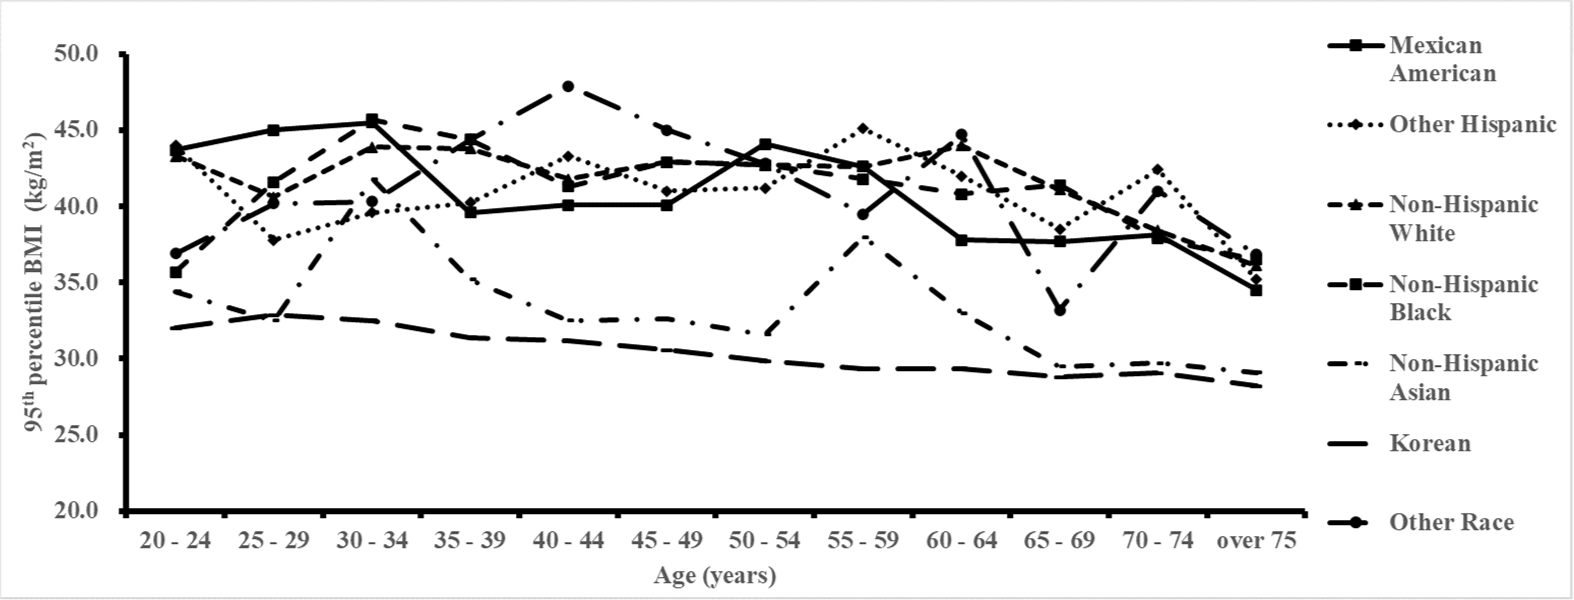
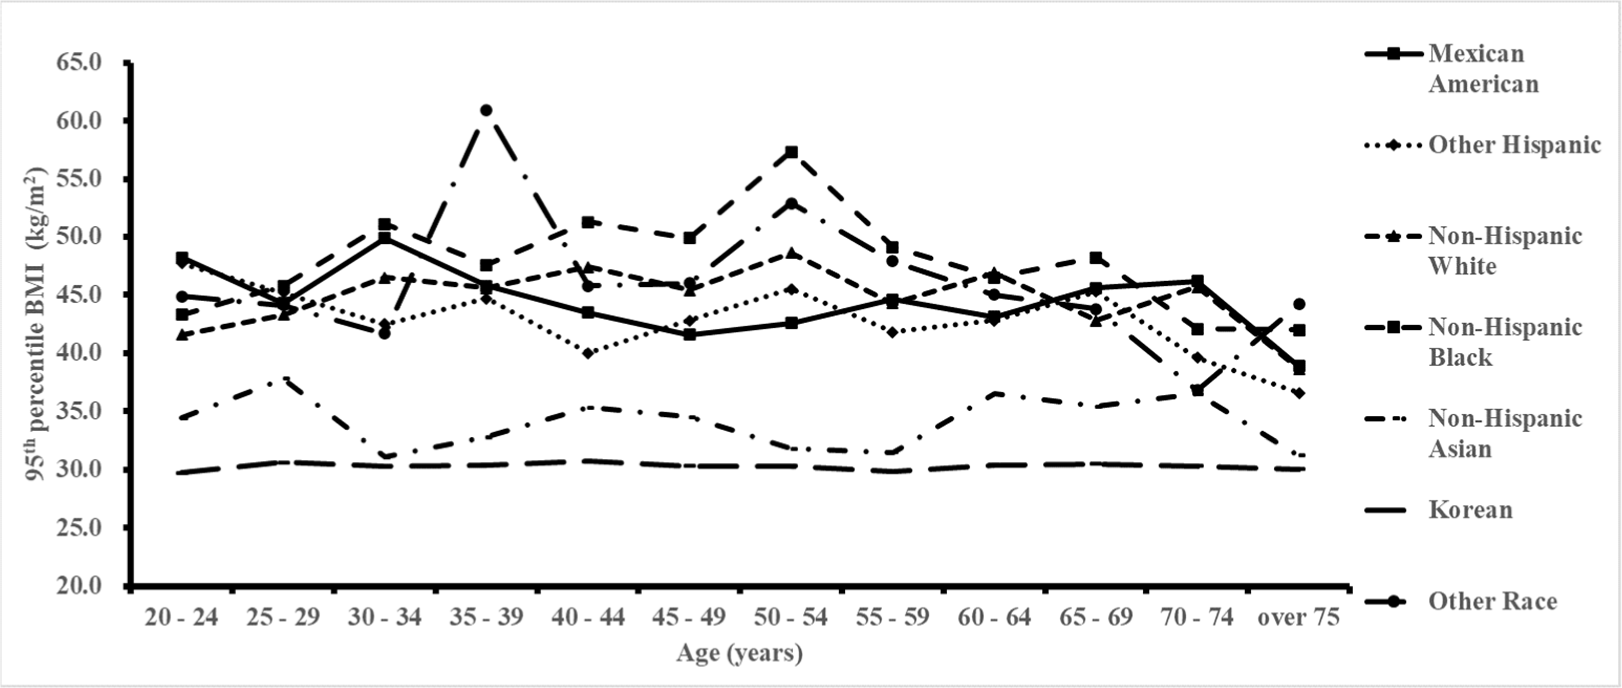
Fig. 1-4 shows the distribution of the average, 85th percentile (overweight), and 95th percentile (obesity) BMI cutoff values from Table 1 according to age, race, and sex. These two percentile cutoff values represent the criteria for overweight and obesity, respectively.
Fig. 1.
BMI distribution by age and ethnicity from NHANES and KNHANES; Mean BMI of men.
Abbreviations: BMI, body mass index; KNHANES, Korea National Health and Nutrition Examination Survey; NHANES, National Health and Nutrition Examination Survey
Download Original Figure
Fig. 2.
BMI distribution by age and ethnicity from NHANES and KNHANES; Mean BMI of women
Abbreviations: BMI, body mass index; KNHANES, Korea National Health and Nutrition Examination Survey; NHANES, National Health and Nutrition Examination Survey
Download Original Figure
Fig. 3.
BMI distribution by age and ethnicity from NHANES and KNHANES; BMI of the 95th percentile of men
Abbreviations: BMI, body mass index; KNHANES, Korea National Health and Nutrition Examination Survey; NHANES, National Health and Nutrition Examination Survey
Download Original Figure
Fig. 4.
BMI distribution by age and ethnicity from NHANES and KNHANES; BMI of the 95th percentile of women
Abbreviations: BMI, body mass index; KNHANES, Korea National Health and Nutrition Examination Survey; NHANES, National Health and Nutrition Examination Survey
Download Original Figure
Table 1.
Mean and 95th percentile of BMI by age, sex, and ethnicity from NHANES and KNHANES data
|
Ethnicity |
|
Sex |
Age (years) |
Mexican American |
Other Hispanic |
Non-Hispanic White |
Non-Hispanic Black |
Non-Hispanic Asian |
Korean |
Other race |
|
Mean BMI |
Male |
20 - 24 |
29.21 |
28.50 |
28.40 |
25.49 |
25.69 |
23.96 |
27.94 |
|
25 - 29 |
30.87 |
29.08 |
27.80 |
28.15 |
25.43 |
25.14 |
28.78 |
|
30 - 34 |
30.50 |
30.48 |
30.35 |
30.71 |
27.84 |
25.46 |
29.59 |
|
35 - 39 |
31.04 |
29.41 |
29.89 |
29.72 |
26.95 |
25.23 |
29.44 |
|
40 - 44 |
31.10 |
31.49 |
30.34 |
31.26 |
25.99 |
25.14 |
33.30 |
|
45 - 49 |
30.10 |
29.81 |
30.37 |
31.20 |
26.22 |
25.03 |
30.27 |
|
50 - 54 |
31.22 |
30.87 |
29.91 |
30.06 |
25.93 |
24.84 |
30.41 |
|
55 - 59 |
30.55 |
30.98 |
29.71 |
29.76 |
25.88 |
24.47 |
29.33 |
|
60 - 64 |
30.04 |
30.75 |
30.40 |
28.87 |
25.75 |
24.41 |
31.10 |
|
65 - 69 |
30.29 |
29.65 |
30.39 |
29.64 |
25.08 |
24.14 |
27.27 |
|
70 - 74 |
29.56 |
29.36 |
29.28 |
29.02 |
24.29 |
23.97 |
30.21 |
|
Over 75 |
27.99 |
27.74 |
28.25 |
27.10 |
24.56 |
23.28 |
28.71 |
|
Female |
20 - 24 |
29.65 |
28.45 |
26.96 |
29.11 |
23.86 |
21.84 |
30.02 |
|
25 - 29 |
30.16 |
29.62 |
29.11 |
30.77 |
25.32 |
22.20 |
30.20 |
|
30 - 34 |
31.30 |
29.36 |
29.52 |
32.42 |
24.19 |
22.58 |
29.89 |
|
35 - 39 |
32.57 |
29.26 |
30.66 |
33.57 |
24.40 |
22.80 |
35.13 |
|
40 - 44 |
31.52 |
29.94 |
31.19 |
35.06 |
24.51 |
23.04 |
31.43 |
|
45 - 49 |
32.42 |
31.97 |
31.19 |
34.43 |
25.96 |
23.57 |
29.21 |
|
50 - 54 |
31.30 |
30.36 |
31.28 |
35.49 |
25.13 |
23.75 |
33.92 |
|
55 - 59 |
31.77 |
31.52 |
30.15 |
33.72 |
24.76 |
23.86 |
29.97 |
|
60 - 64 |
32.28 |
30.72 |
30.97 |
32.29 |
25.61 |
24.37 |
31.69 |
|
65 - 69 |
32.09 |
31.41 |
30.85 |
32.42 |
25.82 |
24.55 |
33.38 |
|
70 - 74 |
32.22 |
29.81 |
30.73 |
31.40 |
26.05 |
24.55 |
31.40 |
|
Over 75 |
29.48 |
28.43 |
28.27 |
29.88 |
24.00 |
24.18 |
26.83 |
|
95th percentile BMI |
Male |
20 - 24 |
43.7 |
44.0 |
43.3 |
35.7 |
34.4 |
32.0 |
36.9 |
|
25 - 29 |
45.0 |
37.8 |
40.6 |
41.6 |
32.5 |
32.9 |
40.2 |
|
30 - 34 |
45.5 |
39.6 |
43.9 |
45.7 |
41.8 |
32.5 |
40.3 |
|
35 - 39 |
39.6 |
40.3 |
43.8 |
44.4 |
35.2 |
31.4 |
44.4 |
|
40 - 44 |
40.1 |
43.3 |
41.8 |
41.3 |
32.5 |
31.2 |
47.9 |
|
45 - 49 |
40.1 |
41.0 |
42.9 |
42.9 |
32.6 |
30.6 |
45.0 |
|
50 - 54 |
44.1 |
41.2 |
42.7 |
42.7 |
31.6 |
29.9 |
42.8 |
|
55 - 59 |
42.6 |
45.1 |
42.6 |
41.8 |
38.0 |
29.3 |
39.5 |
|
60 - 64 |
37.8 |
42.0 |
44.0 |
40.8 |
33.0 |
29.4 |
44.7 |
|
65 - 69 |
37.7 |
38.5 |
41.1 |
41.4 |
29.5 |
28.8 |
33.2 |
|
70 - 74 |
38.1 |
42.4 |
38.4 |
37.9 |
29.7 |
29.0 |
41.0 |
|
Over 75 |
34.5 |
35.2 |
36.1 |
36.5 |
29.1 |
28.2 |
36.9 |
|
Female |
20 - 24 |
48.2 |
47.7 |
41.6 |
43.3 |
34.4 |
29.7 |
44.9 |
|
25 - 29 |
44.3 |
45.2 |
43.3 |
45.8 |
37.8 |
30.6 |
44.1 |
|
30 - 34 |
49.9 |
42.5 |
46.5 |
51.1 |
31.1 |
30.3 |
41.7 |
|
35 - 39 |
45.8 |
44.7 |
45.6 |
47.6 |
32.8 |
30.4 |
60.9 |
|
40 - 44 |
43.5 |
40.0 |
47.4 |
51.3 |
35.3 |
30.7 |
45.8 |
|
45 - 49 |
41.6 |
42.8 |
45.4 |
49.9 |
34.5 |
30.3 |
46.0 |
|
50 - 54 |
42.6 |
45.5 |
48.6 |
57.3 |
31.8 |
30.3 |
52.9 |
|
55 - 59 |
44.6 |
41.8 |
44.3 |
49.1 |
31.5 |
29.8 |
47.9 |
|
60 - 64 |
43.1 |
42.8 |
46.9 |
46.5 |
36.5 |
30.4 |
45.0 |
|
65 - 69 |
45.6 |
45.3 |
42.8 |
48.2 |
35.4 |
30.5 |
43.8 |
|
70 - 74 |
46.2 |
39.6 |
45.7 |
42.1 |
36.5 |
30.3 |
36.8 |
|
Over 75 |
38.9 |
36.6 |
38.7 |
42.0 |
31.2 |
30.0 |
44.2 |
Download Excel Table
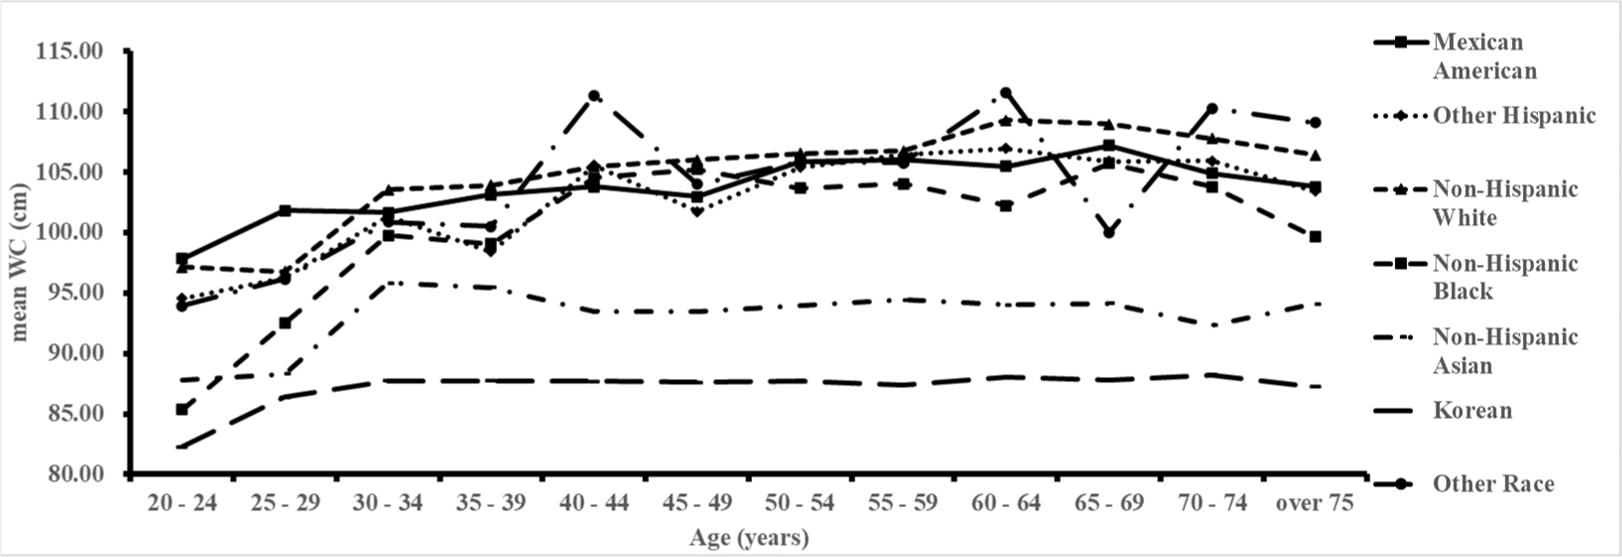
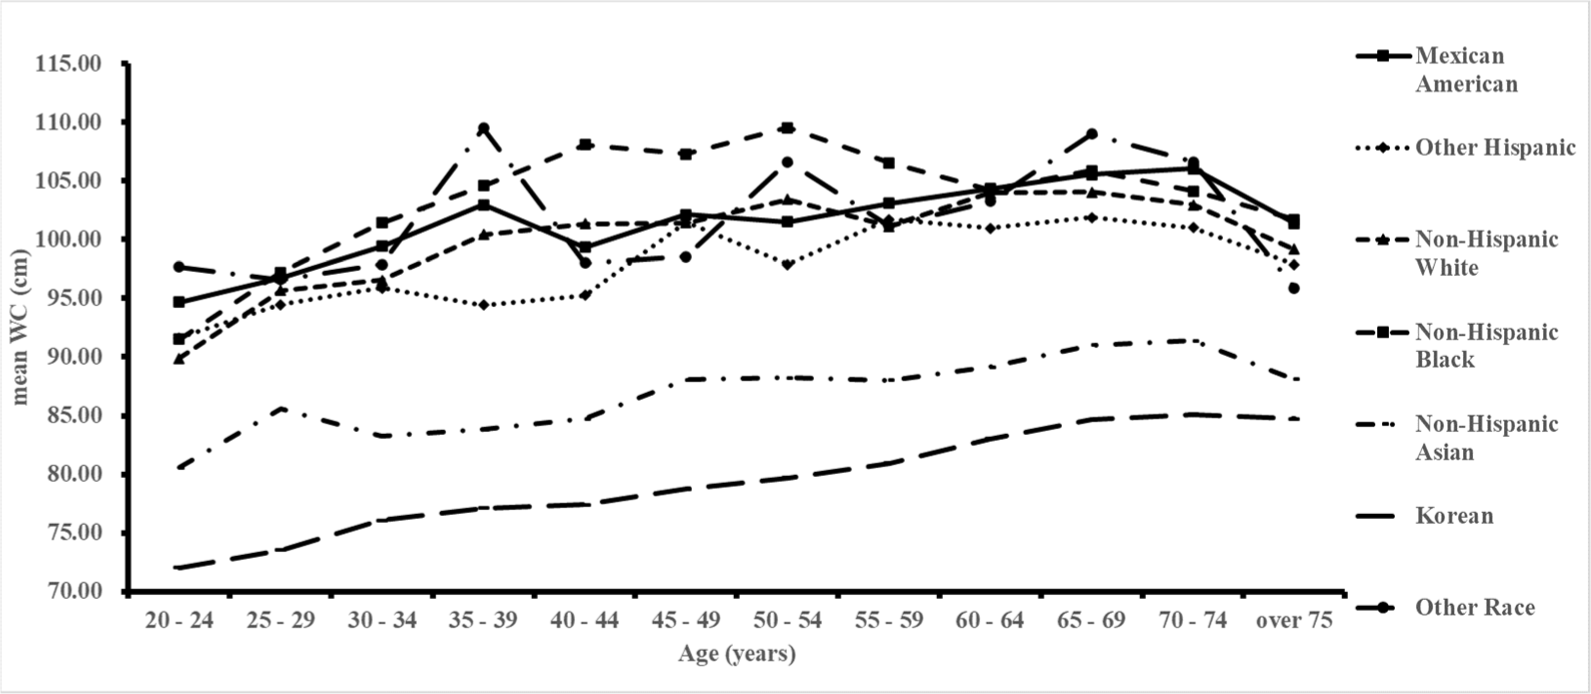
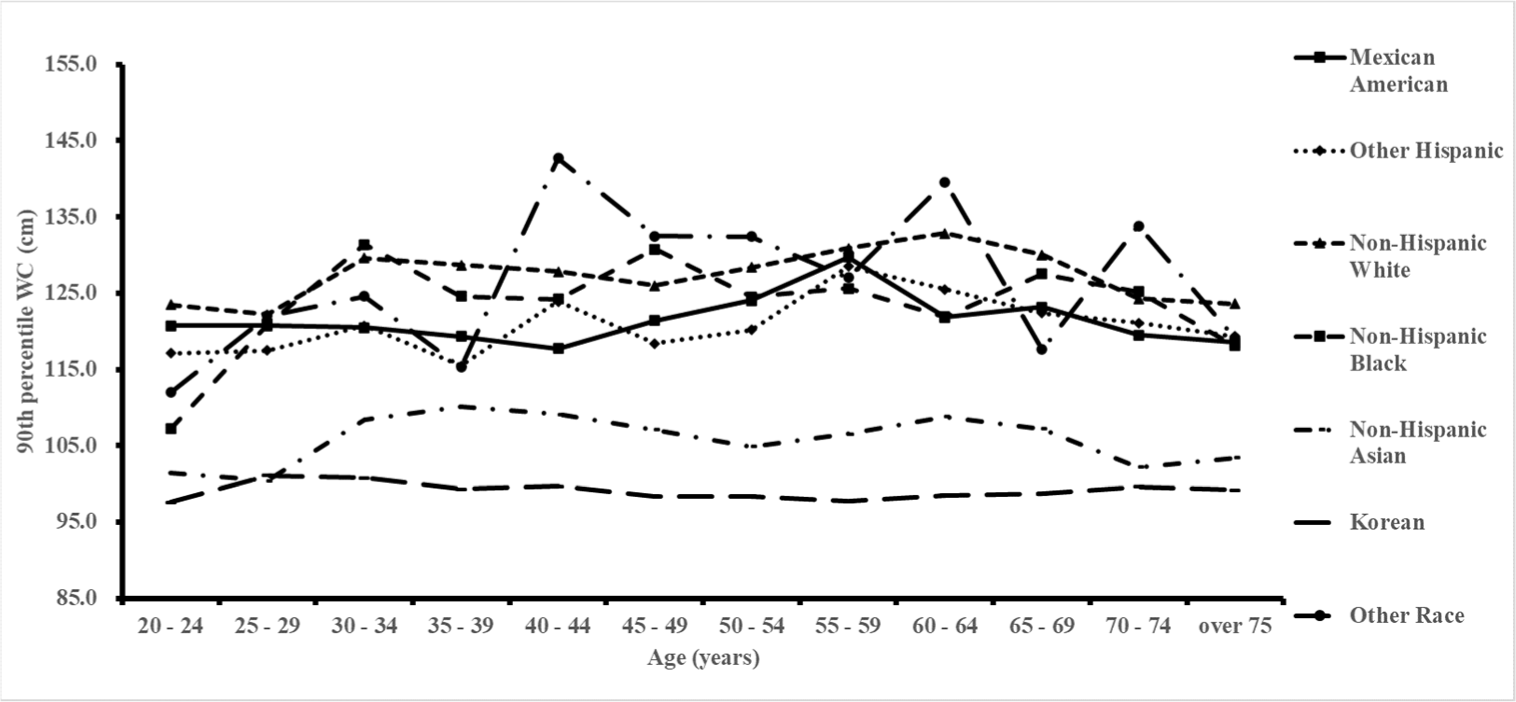
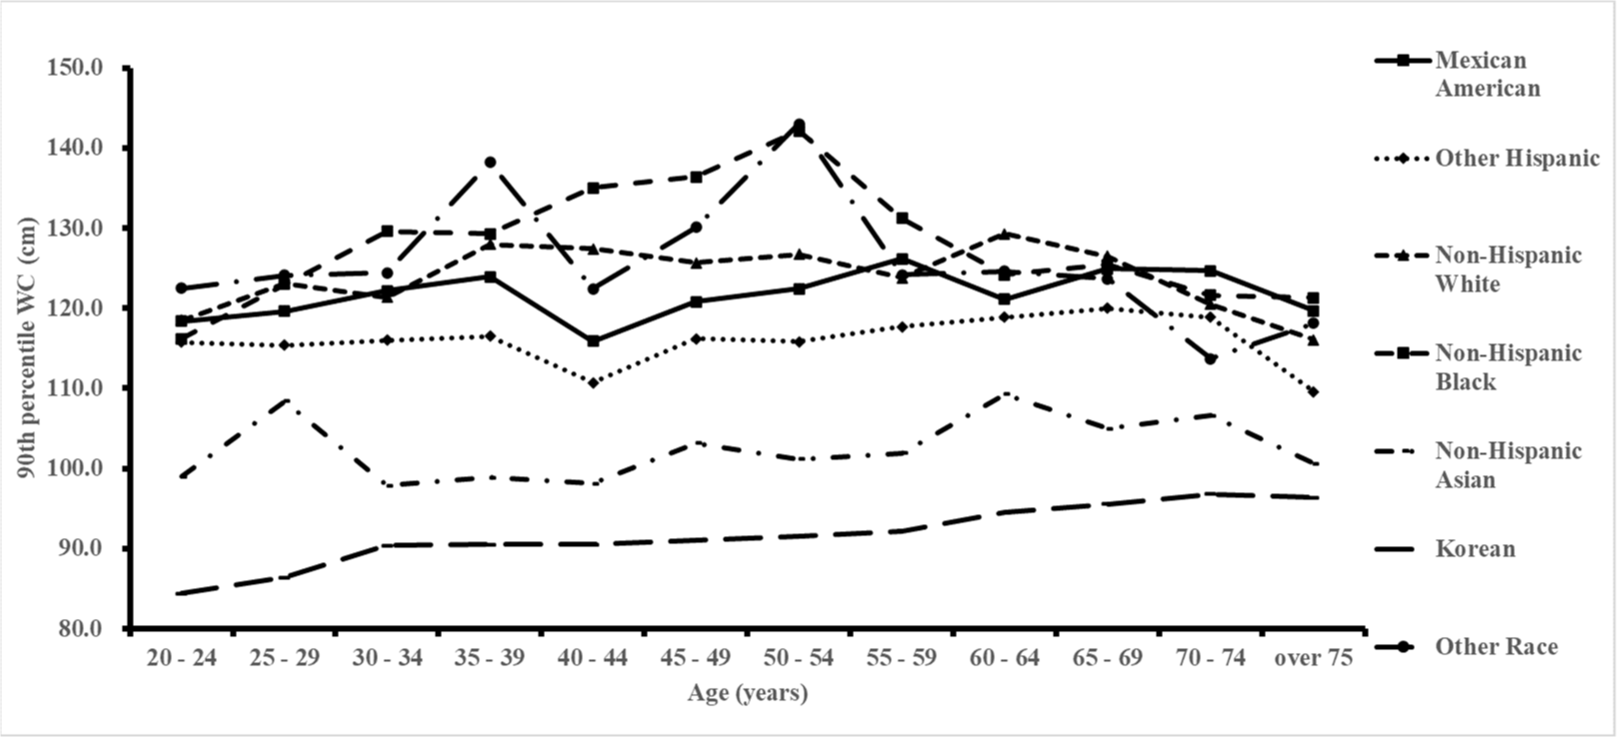
Fig. 5-8 shows the distribution of the mean and 90th percentile (abdominal obesity) WC cutoff values from Table 2 in terms of age, race, and sex. The peaks varied according to the mean or 90th percentile BMI or WC cutoff values.
Fig. 5.
WC distribution by age and ethnicity based on the NHANES and KNHANES data; Mean WC of men
Abbreviations: KNHANES, Korea National Health and Nutrition Examination Survey; NHANES, National Health and Nutrition Examination Survey; WC, waist circumference
Download Original Figure
Fig. 6.
WC distribution by age and ethnicity based on the NHANES and KNHANES data; Mean WC of women
Abbreviations: KNHANES, Korea National Health and Nutrition Examination Survey; NHANES, National Health and Nutrition Examination Survey; WC, waist circumference
Download Original Figure
Fig. 7.
WC distribution by age and ethnicity based on the NHANES and KNHANES data; WC of the 90th percentile, of men
Abbreviations: KNHANES, Korea National Health and Nutrition Examination Survey; NHANES, National Health and Nutrition Examination Survey; WC, waist circumference
Download Original Figure
Fig. 8.
WC distribution by age and ethnicity based on the NHANES and KNHANES data; WC of the 90th percentile of women
Abbreviations: KNHANES, Korea National Health and Nutrition Examination Survey; NHANES, National Health and Nutrition Examination Survey; WC, waist circumference
Download Original Figure
Table 2.
Mean and 90th percentile WC based on the NHANES and KNHANES data
|
Ethnicity |
|
Sex |
Age (years) |
Mexican American |
Other Hispanic |
Non-Hispanic White |
Non-Hispanic Black |
Non-Hispanic Asian |
Korean |
Other race |
|
Mean WC |
Male |
20 - 24 |
97.84 |
94.53 |
97.12 |
85.34 |
87.77 |
82.29 |
93.92 |
|
25 - 29 |
101.81 |
96.23 |
96.76 |
92.50 |
88.31 |
86.38 |
96.13 |
|
30 - 34 |
101.65 |
101.38 |
103.52 |
99.78 |
95.84 |
87.74 |
100.87 |
|
35 - 39 |
103.13 |
98.40 |
103.92 |
99.08 |
95.46 |
87.75 |
100.51 |
|
40 - 44 |
103.78 |
105.55 |
105.46 |
104.52 |
93.49 |
87.69 |
111.32 |
|
45 - 49 |
102.96 |
101.75 |
106.00 |
105.22 |
93.45 |
87.63 |
104.00 |
|
50 - 54 |
105.88 |
105.38 |
106.53 |
103.68 |
93.97 |
87.75 |
105.87 |
|
55 - 59 |
106.01 |
106.44 |
106.73 |
104.04 |
94.41 |
87.41 |
105.74 |
|
60 - 64 |
105.47 |
106.94 |
109.28 |
102.21 |
94.03 |
88.00 |
111.59 |
|
65 - 69 |
107.19 |
105.88 |
108.98 |
105.70 |
94.13 |
87.82 |
100.01 |
|
70 - 74 |
104.91 |
105.91 |
107.76 |
103.79 |
92.32 |
88.23 |
110.29 |
|
Over 75 |
103.80 |
103.40 |
106.43 |
99.64 |
94.10 |
87.25 |
109.08 |
|
Female |
20 - 24 |
94.70 |
91.64 |
89.88 |
91.51 |
80.58 |
72.05 |
97.69 |
|
25 - 29 |
96.75 |
94.47 |
95.66 |
97.21 |
85.57 |
73.54 |
96.60 |
|
30 - 34 |
99.44 |
95.90 |
96.56 |
101.44 |
83.27 |
76.08 |
97.87 |
|
35 - 39 |
102.95 |
94.44 |
100.42 |
104.60 |
83.80 |
77.12 |
109.49 |
|
40 - 44 |
99.33 |
95.28 |
101.35 |
108.10 |
84.71 |
77.39 |
98.03 |
|
45 - 49 |
102.12 |
101.46 |
101.43 |
107.32 |
88.07 |
78.74 |
98.56 |
|
50 - 54 |
101.50 |
97.88 |
103.43 |
109.55 |
88.24 |
79.67 |
106.64 |
|
55 - 59 |
103.09 |
101.70 |
101.13 |
106.54 |
88.01 |
80.93 |
101.16 |
|
60 - 64 |
104.33 |
100.96 |
103.95 |
104.28 |
89.13 |
83.03 |
103.28 |
|
65 - 69 |
105.57 |
101.89 |
104.04 |
105.87 |
91.00 |
84.65 |
109.03 |
|
70 - 74 |
106.07 |
101.02 |
102.99 |
104.13 |
91.38 |
85.11 |
106.64 |
|
Over 75 |
101.38 |
97.88 |
99.19 |
101.73 |
88.10 |
84.74 |
95.90 |
|
90th percentile WC |
Male |
20 - 24 |
120.7 |
117.1 |
123.5 |
107.2 |
101.4 |
97.6 |
112.0 |
|
25 - 29 |
120.7 |
117.5 |
122.2 |
120.9 |
100.4 |
101.1 |
122.0 |
|
30 - 34 |
120.5 |
120.7 |
129.6 |
131.4 |
108.4 |
100.8 |
124.6 |
|
35 - 39 |
119.3 |
115.5 |
128.7 |
124.6 |
110.1 |
99.3 |
115.3 |
|
40 - 44 |
117.7 |
123.9 |
127.8 |
124.2 |
109.1 |
99.7 |
142.7 |
|
45 - 49 |
121.4 |
118.4 |
126.0 |
130.8 |
107.1 |
98.4 |
132.5 |
|
50 - 54 |
124.0 |
120.2 |
128.4 |
124.5 |
104.9 |
98.4 |
132.4 |
|
55 - 59 |
129.7 |
128.5 |
130.9 |
125.7 |
106.6 |
97.7 |
127.0 |
|
60 - 64 |
121.8 |
125.5 |
132.9 |
121.9 |
108.8 |
98.5 |
139.6 |
|
65 - 69 |
123.2 |
122.4 |
130.0 |
127.5 |
107.2 |
98.7 |
117.6 |
|
70 - 74 |
119.5 |
121.1 |
124.3 |
125.2 |
102.2 |
99.6 |
133.8 |
|
Over 75 |
118.5 |
119.3 |
123.6 |
118.1 |
103.4 |
99.2 |
119.1 |
|
Female |
20 - 24 |
118.4 |
115.8 |
118.5 |
116.2 |
99.0 |
84.4 |
122.5 |
|
25 - 29 |
119.6 |
115.4 |
123.1 |
123.0 |
108.4 |
86.4 |
124.1 |
|
30 - 34 |
122.2 |
116.0 |
121.4 |
129.6 |
97.9 |
90.4 |
124.4 |
|
35 - 39 |
123.9 |
116.5 |
128.0 |
129.3 |
98.9 |
90.5 |
138.2 |
|
40 - 44 |
115.9 |
110.7 |
127.4 |
135.0 |
98.1 |
90.5 |
122.4 |
|
45 - 49 |
120.8 |
116.2 |
125.7 |
136.4 |
103.2 |
91.0 |
130.1 |
|
50 - 54 |
122.4 |
115.8 |
126.7 |
142.1 |
101.2 |
91.5 |
143.0 |
|
55 - 59 |
126.2 |
117.7 |
123.8 |
131.2 |
101.9 |
92.2 |
124.2 |
|
60 - 64 |
121.1 |
118.9 |
129.3 |
124.2 |
109.3 |
94.5 |
124.6 |
|
65 - 69 |
124.9 |
120.0 |
126.5 |
125.4 |
105.0 |
95.6 |
123.7 |
|
70 - 74 |
124.7 |
118.9 |
120.5 |
121.6 |
106.6 |
96.8 |
113.7 |
|
Over 75 |
119.7 |
109.6 |
116.1 |
121.3 |
100.6 |
96.4 |
118.1 |
Download Excel Table
These findings support the idea that a new index for measuring general and abdominal obesity should be established. Here, the new criteria for general obesity should be defined as the 95th percentile of BMI, overweight as the 85th percentile of BMI, and abdominal obesity as the 90th percentile of WC.
The 95th percentile of the BMI showed a trend similar to that of the mean BMI. Generally, it increases at a young age and decreases at an older age, which shows a reversed U shape, and differs in terms of age, sex, and ethnicity. The BMI of female groups of other Hispanic, non-Hispanic white, non-Hispanic Black, and other races commonly peaks at ages 50–54 years.
The 90th percentile of WC also showed a reversed U shape. However, there are some exceptions. The WC of the Korean male group decreased at the age of 25 years and had a downward peak at ages 55–59 years. In addition, the female group showed a downward peak in WC at ages 40–44 years.
2.2 Policy implication
As a result, policymakers should provide citizens with special weight-related education, owing to the tendency of weight increase among groups of people according to ethnicity and age.[21-23] In addition, various policies should be implemented, such as allowing people to undergo timely health checkups and holding campaigns to take care of citizens’ health through behavioral modification. Asians have lower BMI and WC than the other ethnic groups; hence, they may interpret it as having a lesser tendency to develop obesity-related diseases. However, they should be educated about the importance of weight control owing to their high body fat content compared with other races. Our main results would be helpful for policymakers to set these criteria.
However, most weight-related diseases are common in developed countries, whose citizens adopt a westernized lifestyle. Westernized meals and lifestyles have been introduced in developing countries, which increased the proportion of newly diagnosed obese patients. Therefore, it is necessary to introduce education and policies related to obesity-related diseases in developing countries to enhance awareness related to obesity and prevent the occurrence of new weight-related diseases in this patient group.[24]
Some groups show specific peaks at certain ages (Fig. 1-4): other Hispanic, non-Hispanic White, non-Hispanic Black, and Korean at ages 50–54 years, while Mexican Americans at the ages 55–59 years. This phenomenon was not observed in men. This may be due to the occurrence of menopause. The median age at the final menstrual period of American women was 52.54 years, and no difference was found between racial and ethnic groups.[25] Hormonal effect, especially fluctuations in estrogen levels, would have affected the changes in weight.[26]
As shown in the figures above, BMI and WC showed a reversed U shape and differed in terms of ethnicity and age. In particular, non-Hispanic Asians and Koreans had the lowest weight-related measures. This may be due to the variance in molecular biological factors, such as enzymatic activity. Four common genetic factors have been associated with class III obesity: insulin-induced gene 2, fat mass- and obesity-associated gene, melanocortin 4 receptor gene, and proprotein convertase subtilisin/kexin type 1 gene.[27] The association of adipocyte-, C1q-, and collagen domain-containing leptin; leptin receptor; and peroxisome proliferator-activated receptor gamma with obesity was also investigated.[28] Polymorphisms in these genes, especially INSIG-2, are also associated with age-related changes in BMI and WC during lipid metabolism.[29]
3. Conclusion
In conclusion, these bi-national large-scale studies found significant age, ethnic, and sex disparities in BMI and WC in both South Korea and the United States. The study highlights the importance of developing targeted interventions to address these disparities, particularly for populations at higher risk of obesity-related health problems. Additionally, the findings suggest that public health policies aimed at reducing obesity and promoting healthy lifestyles should consider age, ethnicity, and sex as key factors in designing effective interventions.
Capsule Summary
The study highlights the importance of developing targeted interventions to address these disparities, particularly for populations at higher risk of obesity-related health problems.
